Firebase Analytics lets you see exactly how users interact with your app. Track automatic and custom events, segment audiences, and measure retention and conversions in real time. Integrated with tools like A/B Testing and Remote Config, it turns raw data into actionable insights that drive engagement, growth, and smarter app decisions.
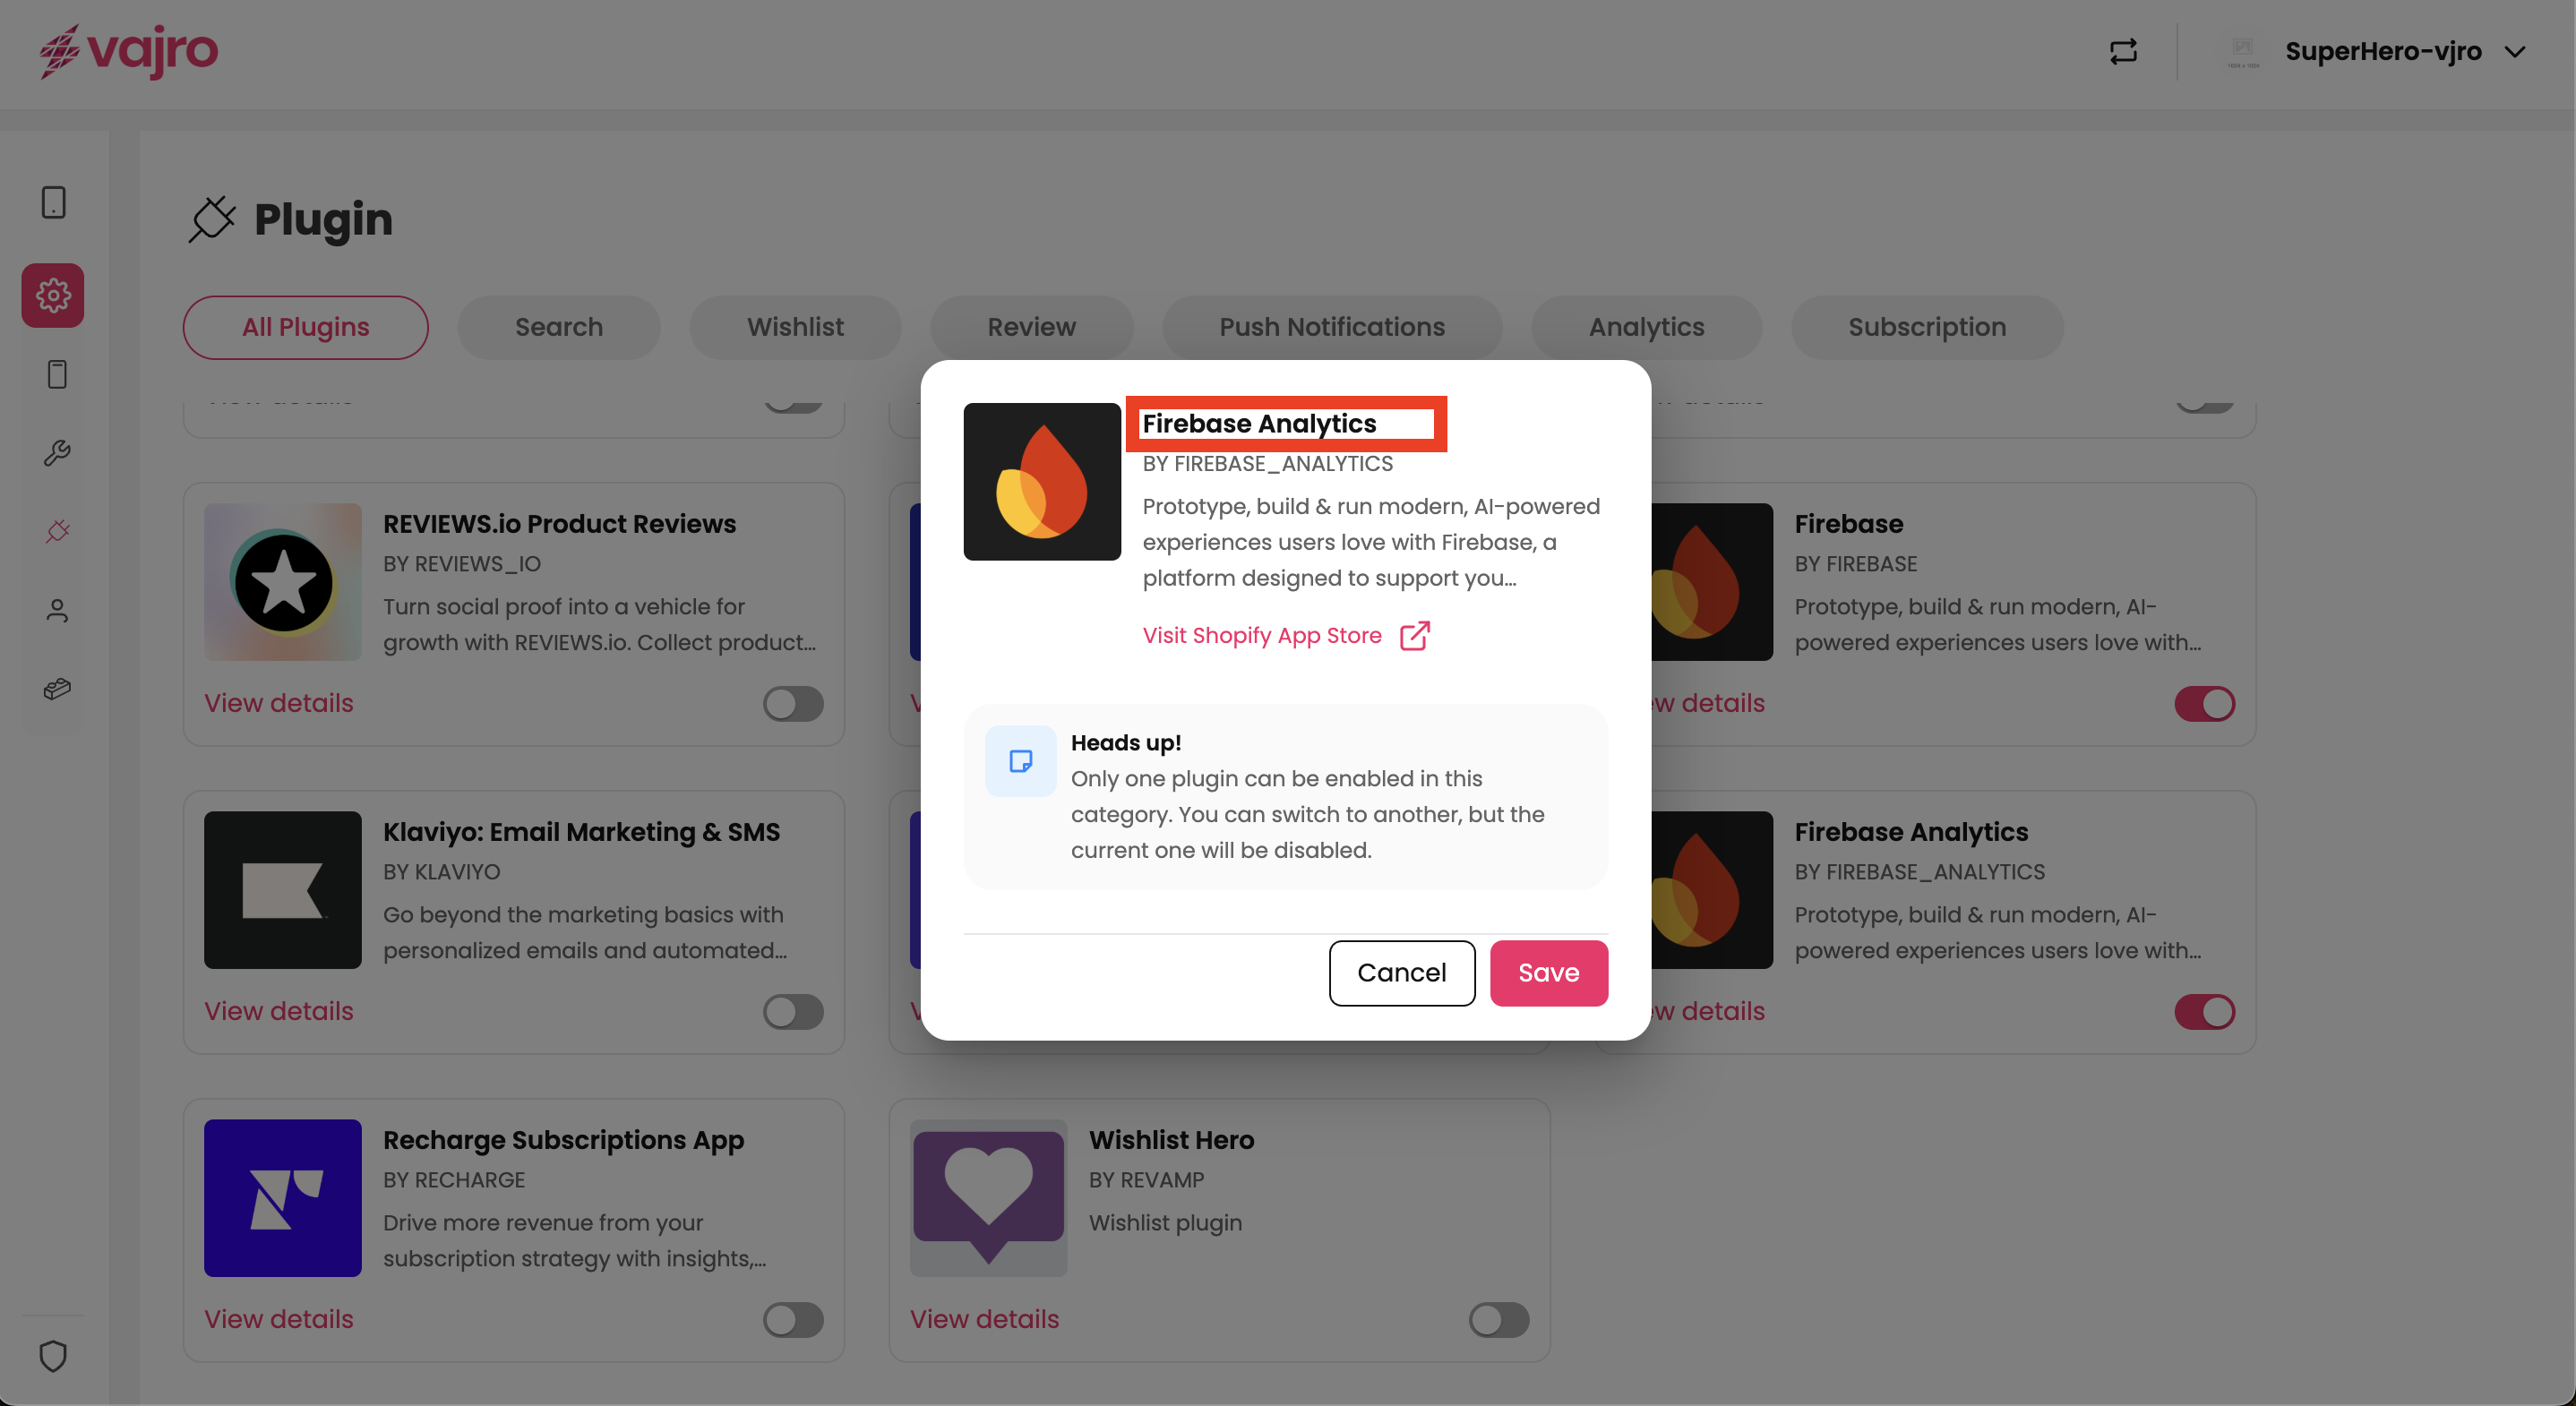
Step 2 : Under the Search category, select Firebase Analytics and toggle it on, click on Save.


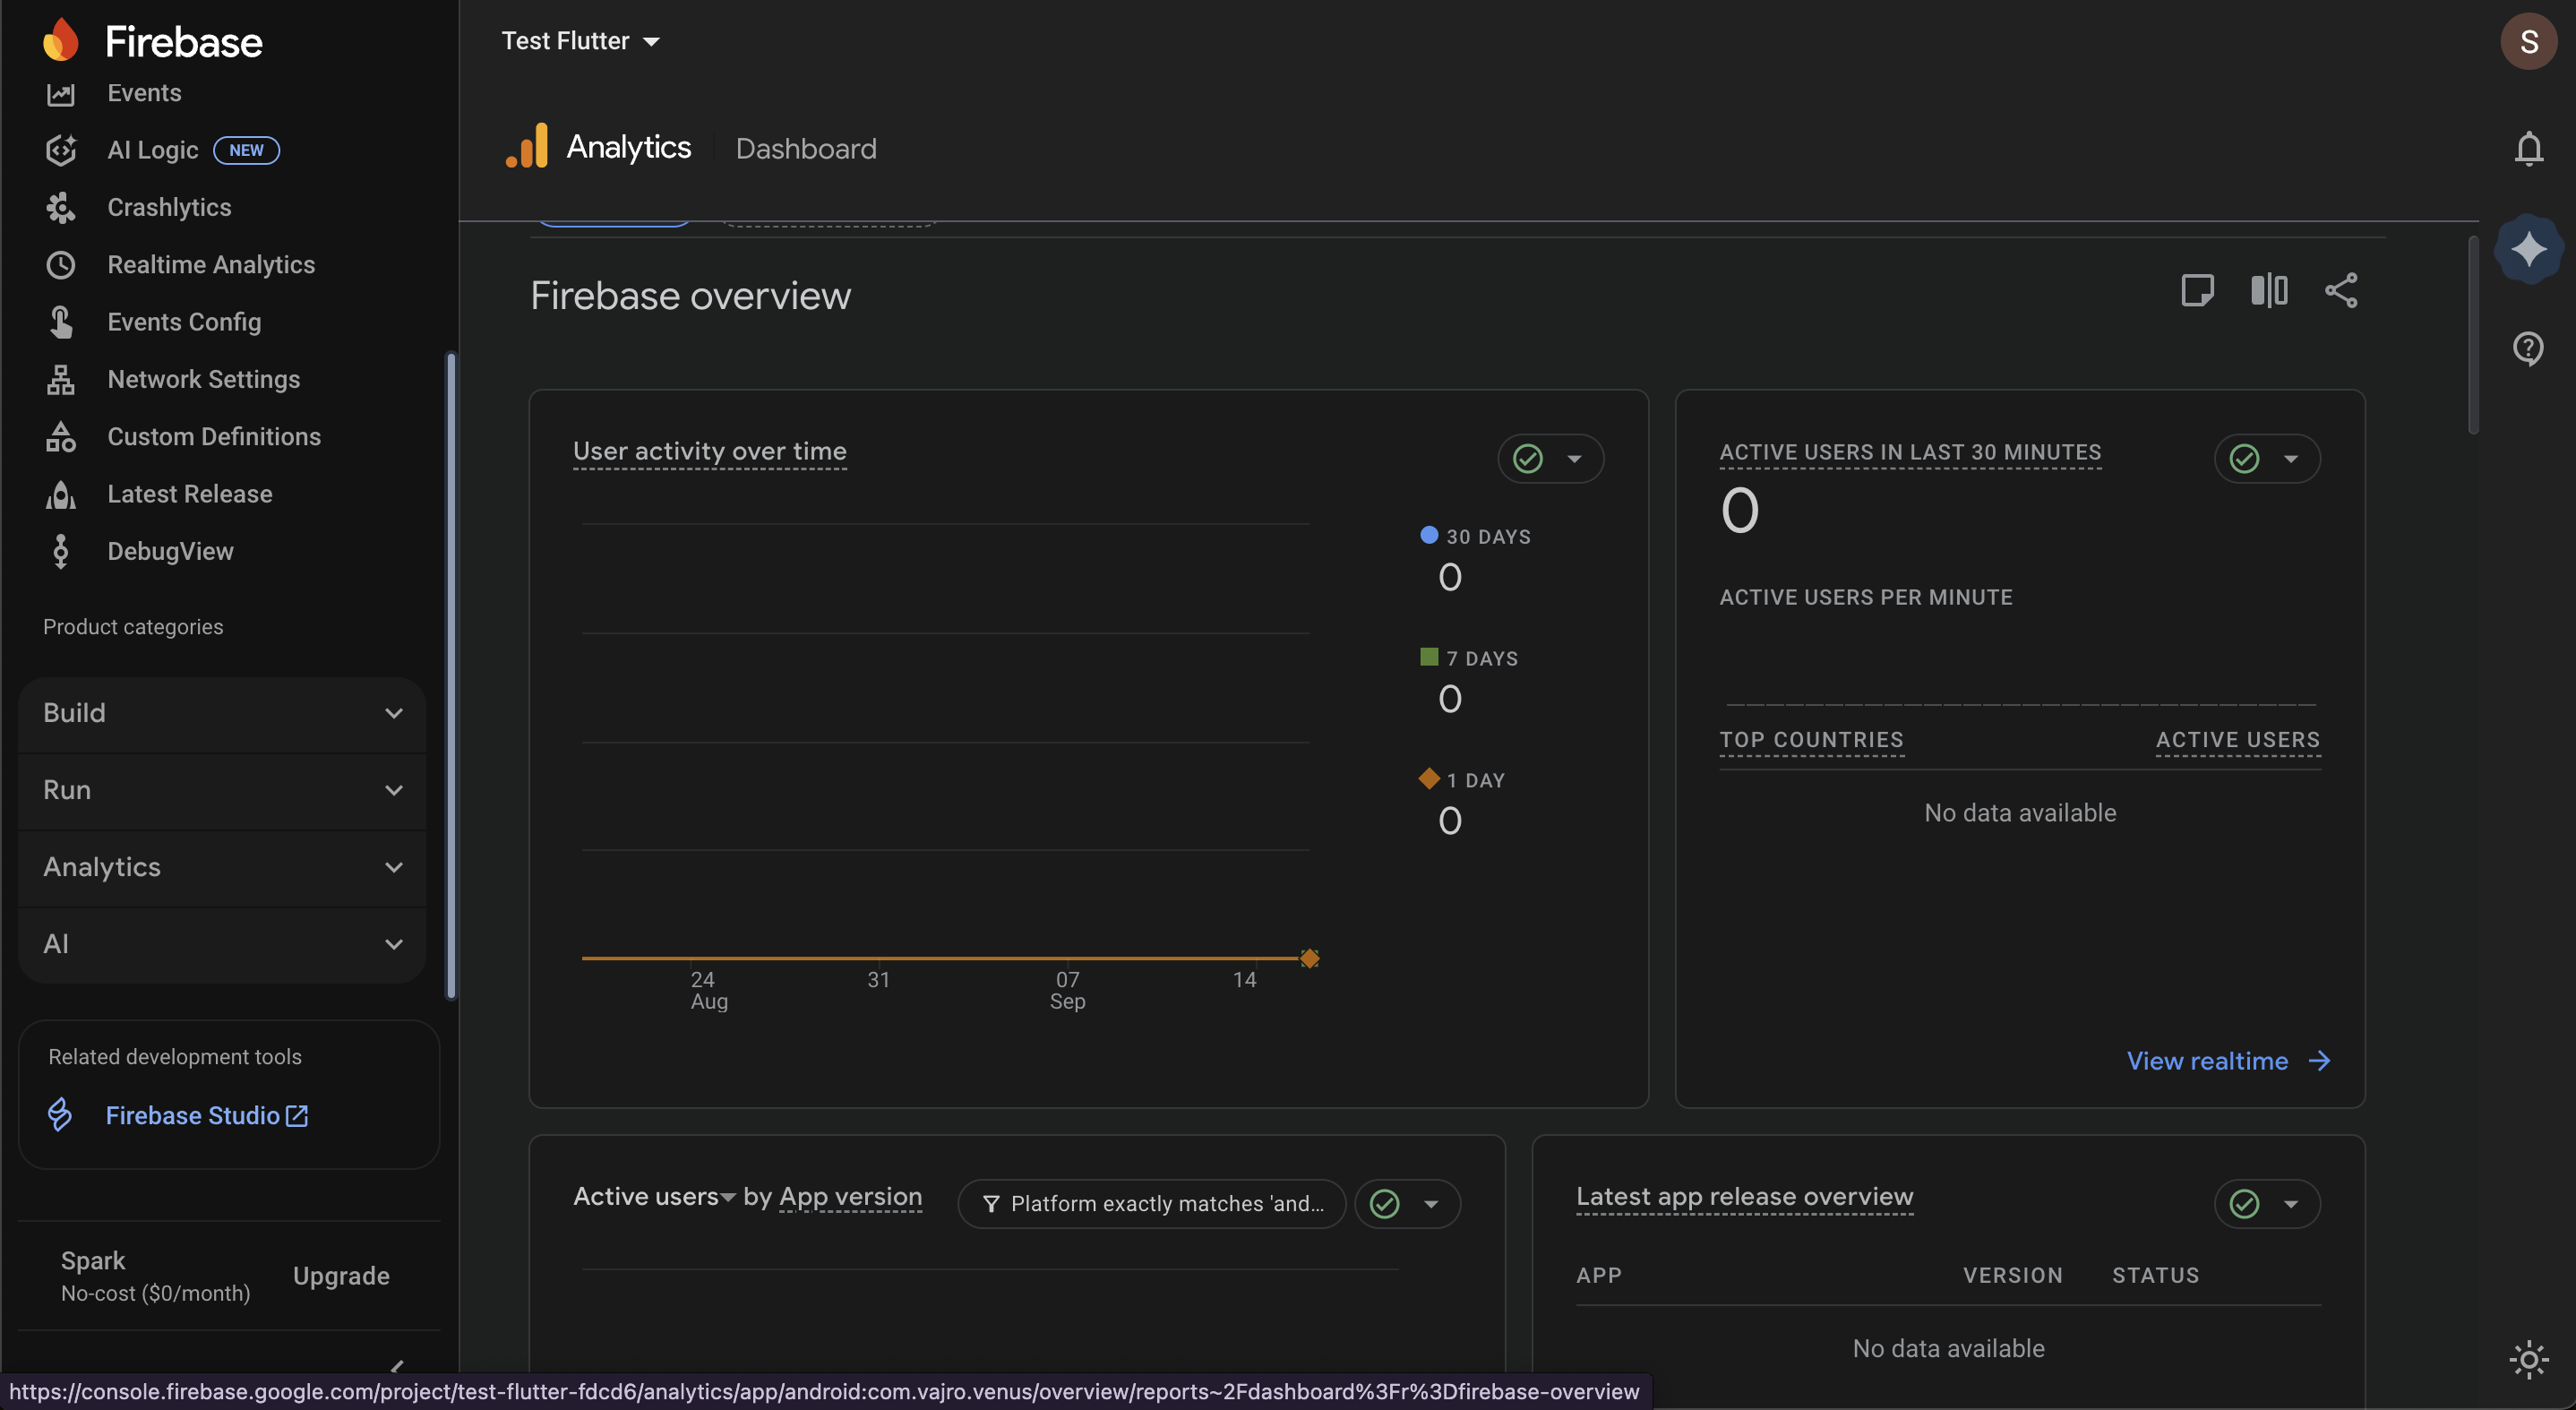
The Firebase Analytics Dashboard gives merchants structured insights into user activity, acquisition, engagement, retention, stability, and revenue.
Go to Firebase Console → Analytics → Analytics Dashboard.
User activity over time (month/day): Track usage patterns and seasonal trends.
Active users in the last 30 mins (top countries): Monitor real-time demand by region.
Active users by app version and platform (iOS/Android): Ensure stable performance across devices.
Latest app release overview (app/version/status): Monitor adoption of new releases.
App stability (crash-free users): Track reliability and reduce churn.
Average engagement time per active user: Measure how long users stay in the app.
Engagement sessions per active user: Track repeat interactions per session.
User retention: Understand how many users return after their first visit.
User activity by cohort: See how groups behave over time.
Active users by first user source: Track where new users are acquired.
First user medium: See if users arrive via organic, paid, referral, or social.
First user source/first user medium: Combine to analyze acquisition quality.
First user source platform: Break down by iOS or Android.
First user campaign: Evaluate the effectiveness of campaigns.
Average 120-day value (by first user channel group): Measure long-term customer value from acquisition channels.
User acquisition cohorts: Compare performance across different acquisition sources.
Active users by audience (active vs new): Measure growth vs retention.
Active users by user property: Segment users by demographics, devices, or behavior.
All users view: Default view of all data.
Add Comparison: Filter users by attributes like country, device, or app version.
Edit Comparison: Refine filters to focus on specific customer groups.
Apply Comparison: See side-by-side performance of different segments (e.g., iOS vs Android, new vs returning users).
Views by page title and screen name: Identify which screens/pages are most visited.
Event count by event name: Track frequency of interactions such as add-to-cart or checkout.
Key events by event name: Focus on business-critical actions.
Total revenue, purchase revenue, ad revenue: See the complete monetization picture.
Average purchase revenue per active user: Estimate the value of each active customer.
Annotations: Add notes for events such as campaign launches or updates.
Custom reporting periods: Change the reporting window (day, week, month, or custom range).
Business use: Identify short-term vs. long-term trends (e.g., compare holiday performance with the previous year).
Share reports: Distribute insights with stakeholders.
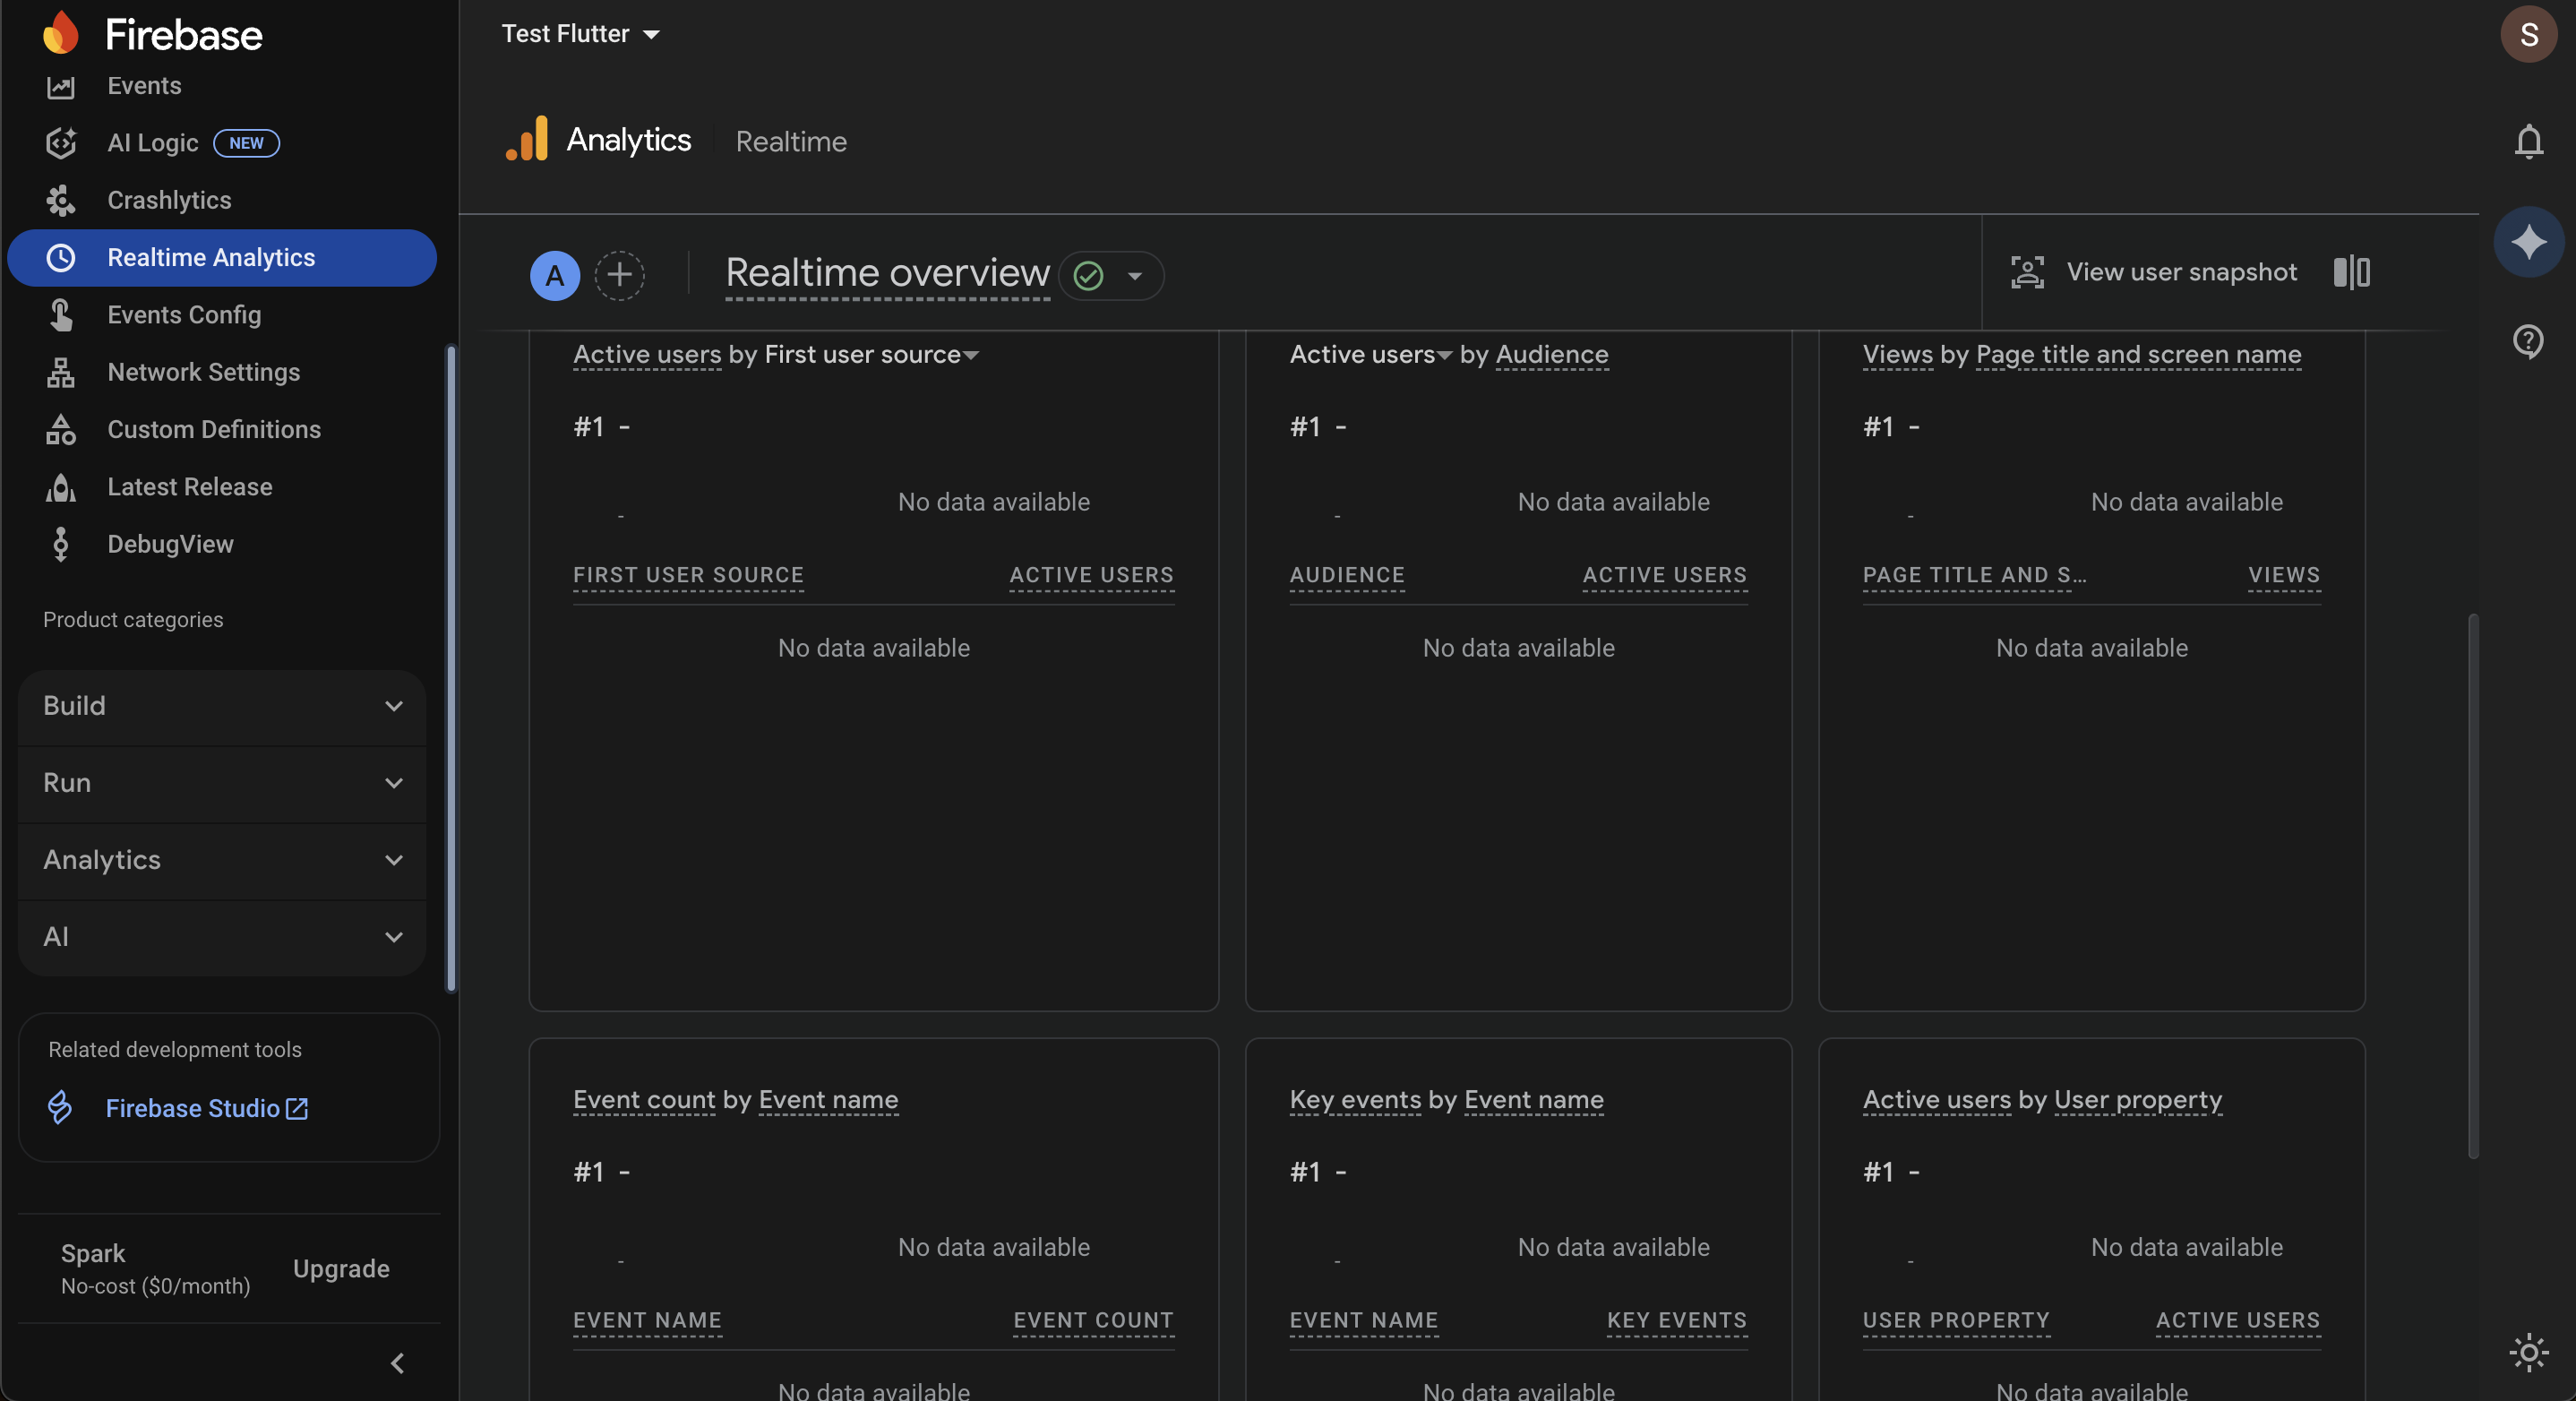
Realtime Analytics provides a live snapshot of what’s happening in your app within the last few minutes.
Go to Firebase Console → Analytics → Realtime Analytics.
Active users in the last 30 mins / 5 mins: Monitor traffic spikes.
Active users by top countries: See immediate geographic demand.
Active users by first user source/medium/campaign: Confirm campaign effectiveness in real time.
Active users by platform or app version: Detect issues tied to a release or device.
Event stream in real time: Watch events as they happen (e.g., add-to-cart, checkout, purchases).
Screen/page activity live: See what users are currently viewing.
View user snapshot: Inspect an individual user’s live activity -device, location, events, and current screen.
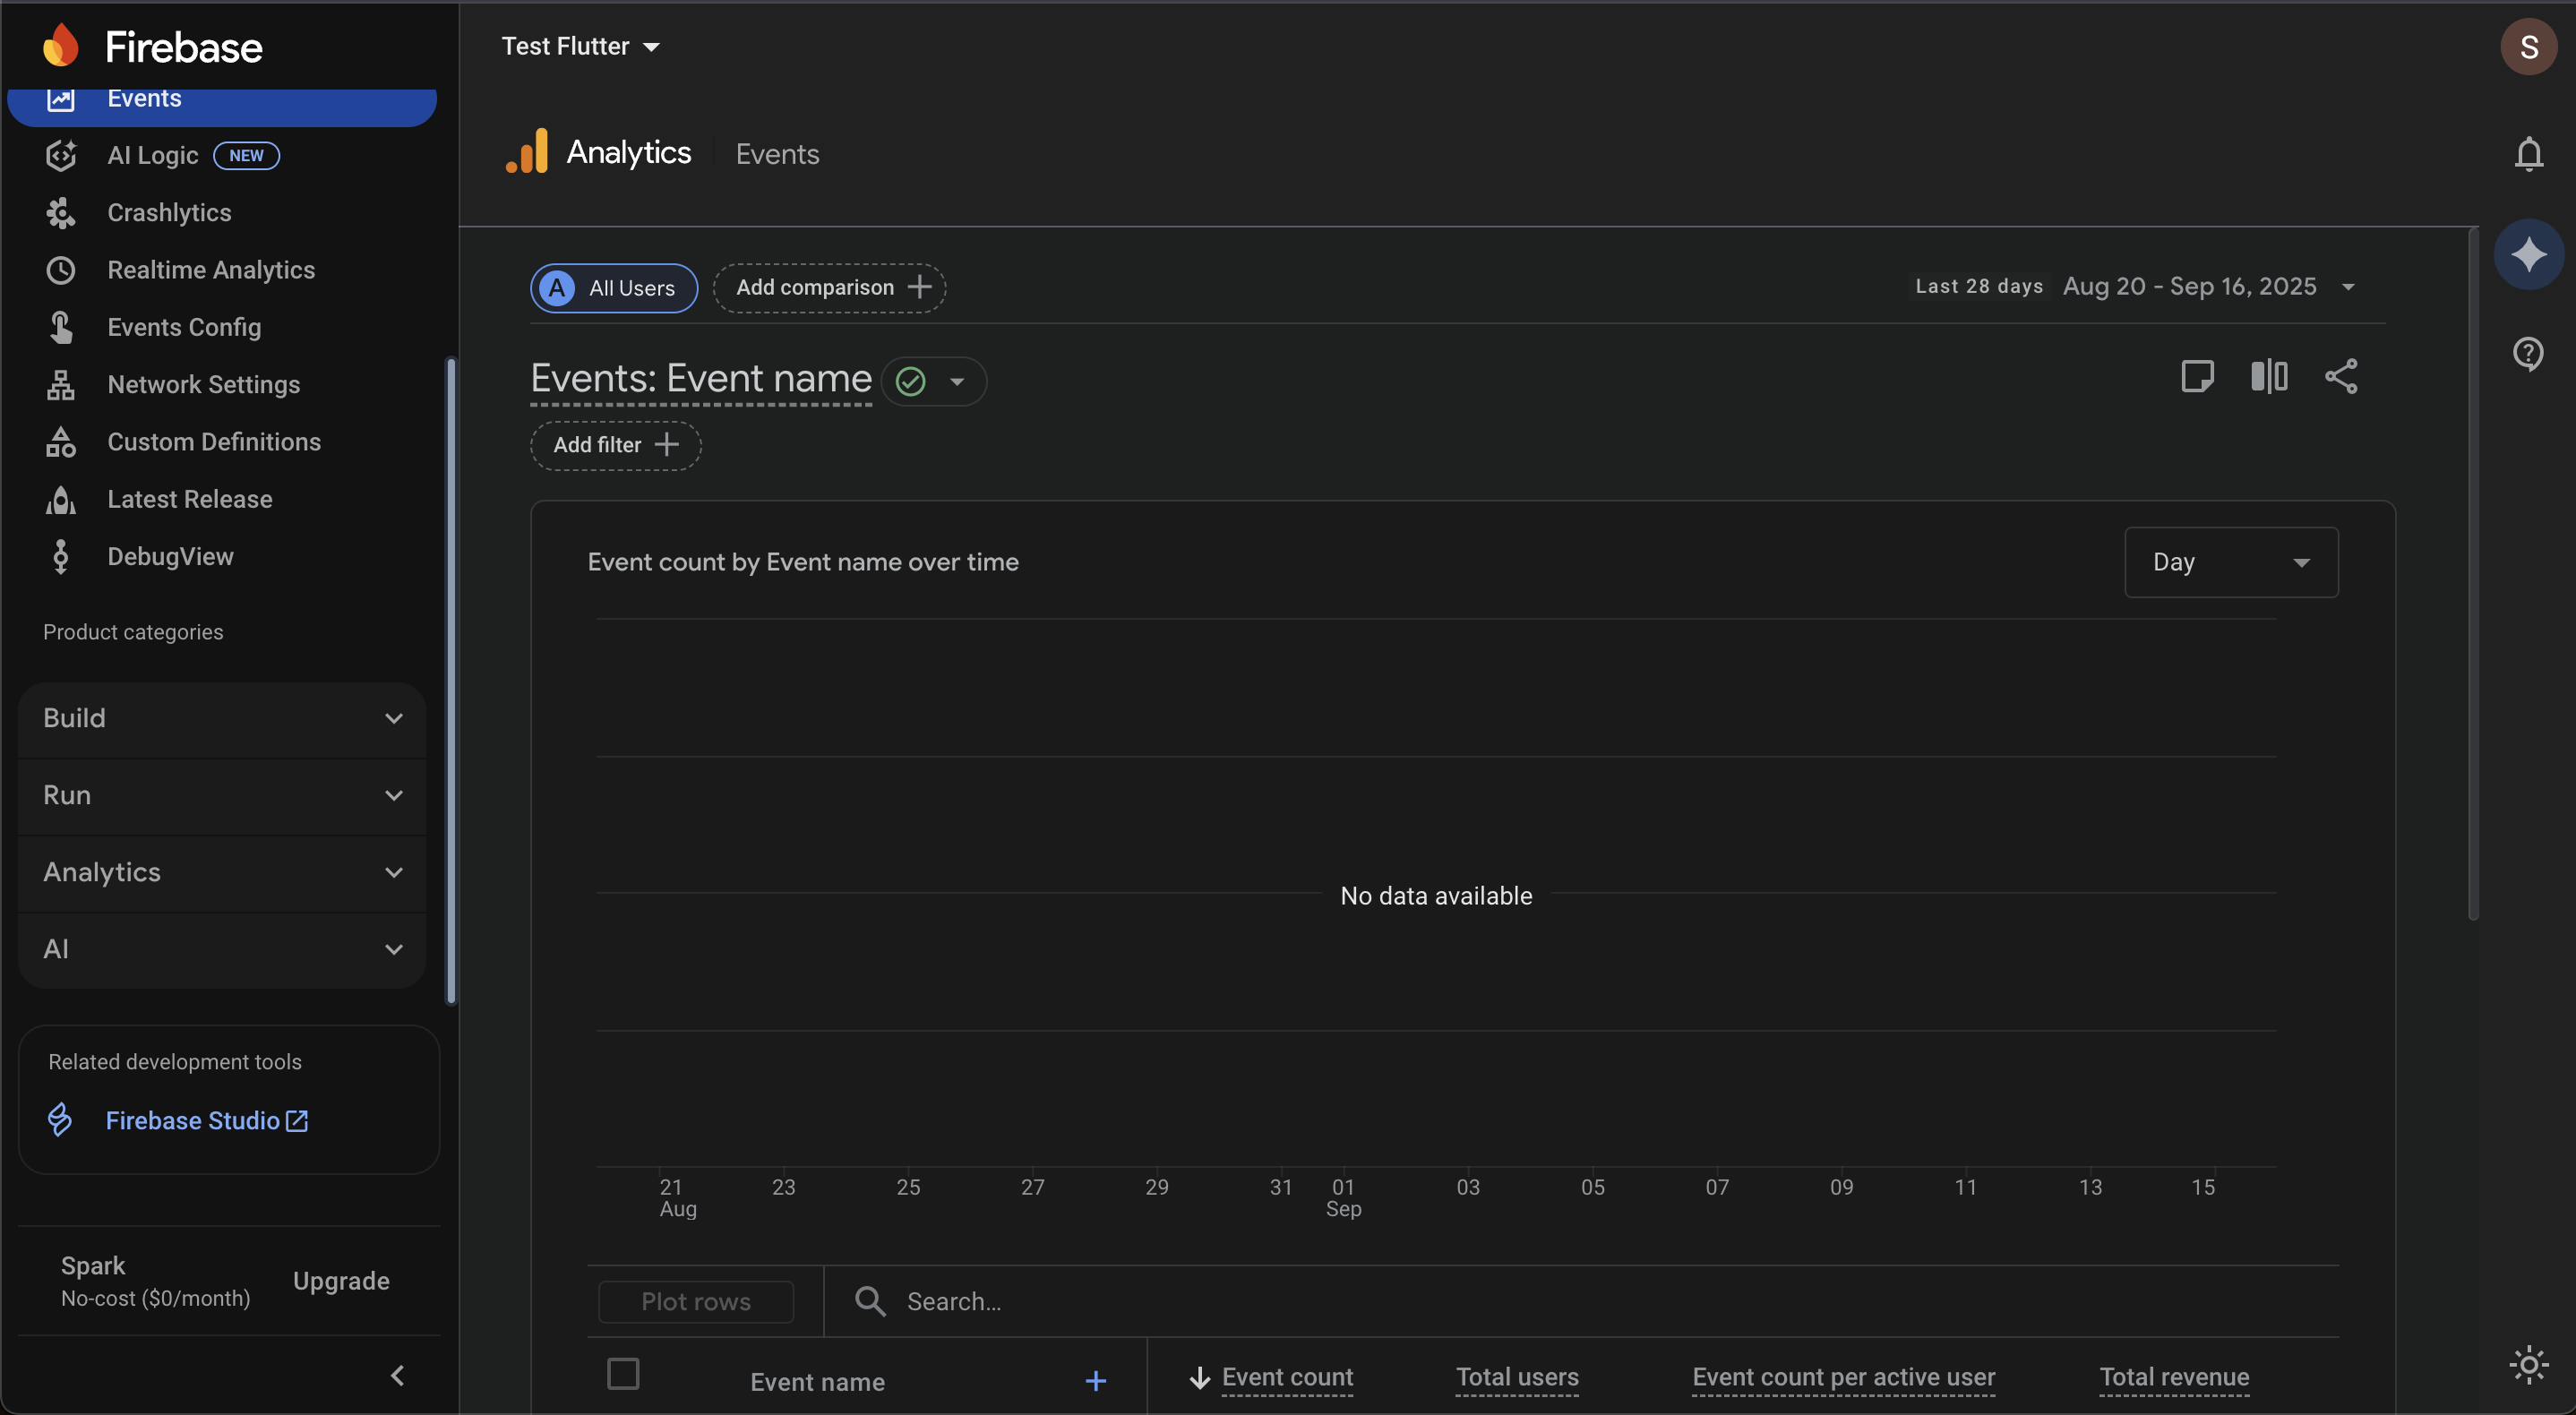
The Events feature lets you track and analyze all user interactions in your app. For each event, you can view its name, total count, unique users, average count per active user, and revenue generated. This provides a clear picture of which actions drive engagement and revenue, helping you optimize features, campaigns, and user experience efficiently.
Go to Firebase Console → Analytics → Events.
User Login - Tracks when a user successfully signs in. Useful for measuring active user base.
User Logout -Tracks when a user signs out. Helpful for session management and churn analysis.
Page Opened - Logs each screen or page a user opens. Helps identify popular or underused sections.
Bottom Bar Switched - Tracks when a user switches tabs from the bottom navigation. Shows feature engagement.
Top Nav Switched -Tracks when a user switches via the top navigation bar. Useful for navigation flow analysis.
Side Nav Opened - Tracks when the side menu is opened. Indicates how often users explore secondary options.
Side Nav Closed - Tracks when the side menu is closed. Complements “Side Nav Opened” for full interaction insights.
Product Viewed - Captures when a user views a product page. Key for product interest metrics.
Collection Viewed - Tracks when a user views a product collection. Useful for catalog performance analysis.
Variant Changed - Logs when a user switches product variants (size, color, etc.). Shows preference patterns.
Added to Wishlist - Tracks when an item is saved to the wishlist. Great for intent-to-purchase signals.
Removed from Wishlist -Tracks when an item is removed from the wishlist. Can highlight shifts in interest.
Cart Updated -Logs any change to the shopping cart. Useful for monitoring cart activity overall.
Added to Cart - Tracks when an item is added to the cart. Crucial for funnel measurement.
Cart Quantity Updated - Tracks when a product’s quantity is changed in the cart. Helps with average order size insights.
Removed from Cart - Logs when an item is deleted from the cart. Useful for analyzing friction or product hesitations.
On Checkout Click - Tracks when the user starts the checkout process. Key milestone in conversion funnel.
Search Performed - Tracks when a search query is entered. Useful for demand and keyword analysis.
Collection Sorted - Logs when a user changes the sort order in a collection. Shows shopping behavior.
Collection Filtered - Tracks when a filter is applied in a collection. Helps identify browsing preferences.
Search Result Sorted -Tracks when a user sorts search results. Indicates how users refine choices.
Search Result Filtered - Logs when filters are applied to search results. Useful for conversion optimization.
Purchase Event - Captures completed transactions. The ultimate conversion metric for revenue analysis.
The Events Configuration section in Firebase Analytics is where you manage how your app’s events are tracked, measured, and attributed. Proper setup ensures your analytics data is accurate, actionable, and aligned with your business goals.
Go to Firebase Console → Analytics → Events Configuration.
The Events Table lists all events collected from your app with key metrics such as Event Count and Users by Event Name.
Recommended Events (e.g., purchase, add_payment_info, add_to_cart) are predefined by Firebase for better reporting and compatibility. These can be deleted if not relevant.
Key Events can be marked by toggling the star icon. These represent important business actions like purchases or sign-ups.
Two lists are available: Key Events and Recent Events, with a search bar for quick filtering.
Maximum items per page: 25.Quota Management
Firebase limits the number of custom key events you can define.
Use the Quota Information link to view your current usage.
Free tier typically allows up to 30 custom key events per project.
Attribution settings control how marketing interactions are credited toward key events:
Attribution Model: Defines how credit is distributed across different touchpoints.
Key Event Lookback Window: Sets the timeframe for attributing interactions to events.
Click-through events: 7 or 30 days.
Engaged-view events (video ads): Fixed at 3 days.
Name the event.
Choose a creation method:
Without code
With code (install tracking code in your app/website; see instructions)
Select a data stream (iOS or Android).
Identify an existing event to act as the trigger for the new event.
Configure event details:
Event Name
Screen Class
Screen Name
Custom Event Name: Define a unique name for the new event.
Matching Conditions: Create a custom event when another event meets all selected conditions.
Parameter Configuration:
Choose Parameter, Operator, and Value (e.g., screen_view or firebase_screen_class).
Option to copy parameters from the source event or modify values (e.g., {{Source_parameter_name}} or abc).
Custom Events: Define events unique to your app’s functionality.
Modifications: Create, edit, or delete events and their parameters to refine data collection.
Firebase Network Settings allow you to identify the source of key events and configure postbacks to optimize your advertising efforts. This is a crucial step for accurately tracking and attributing user acquisition campaigns.
Go to Firebase console -> Analytics -> Network Settings.
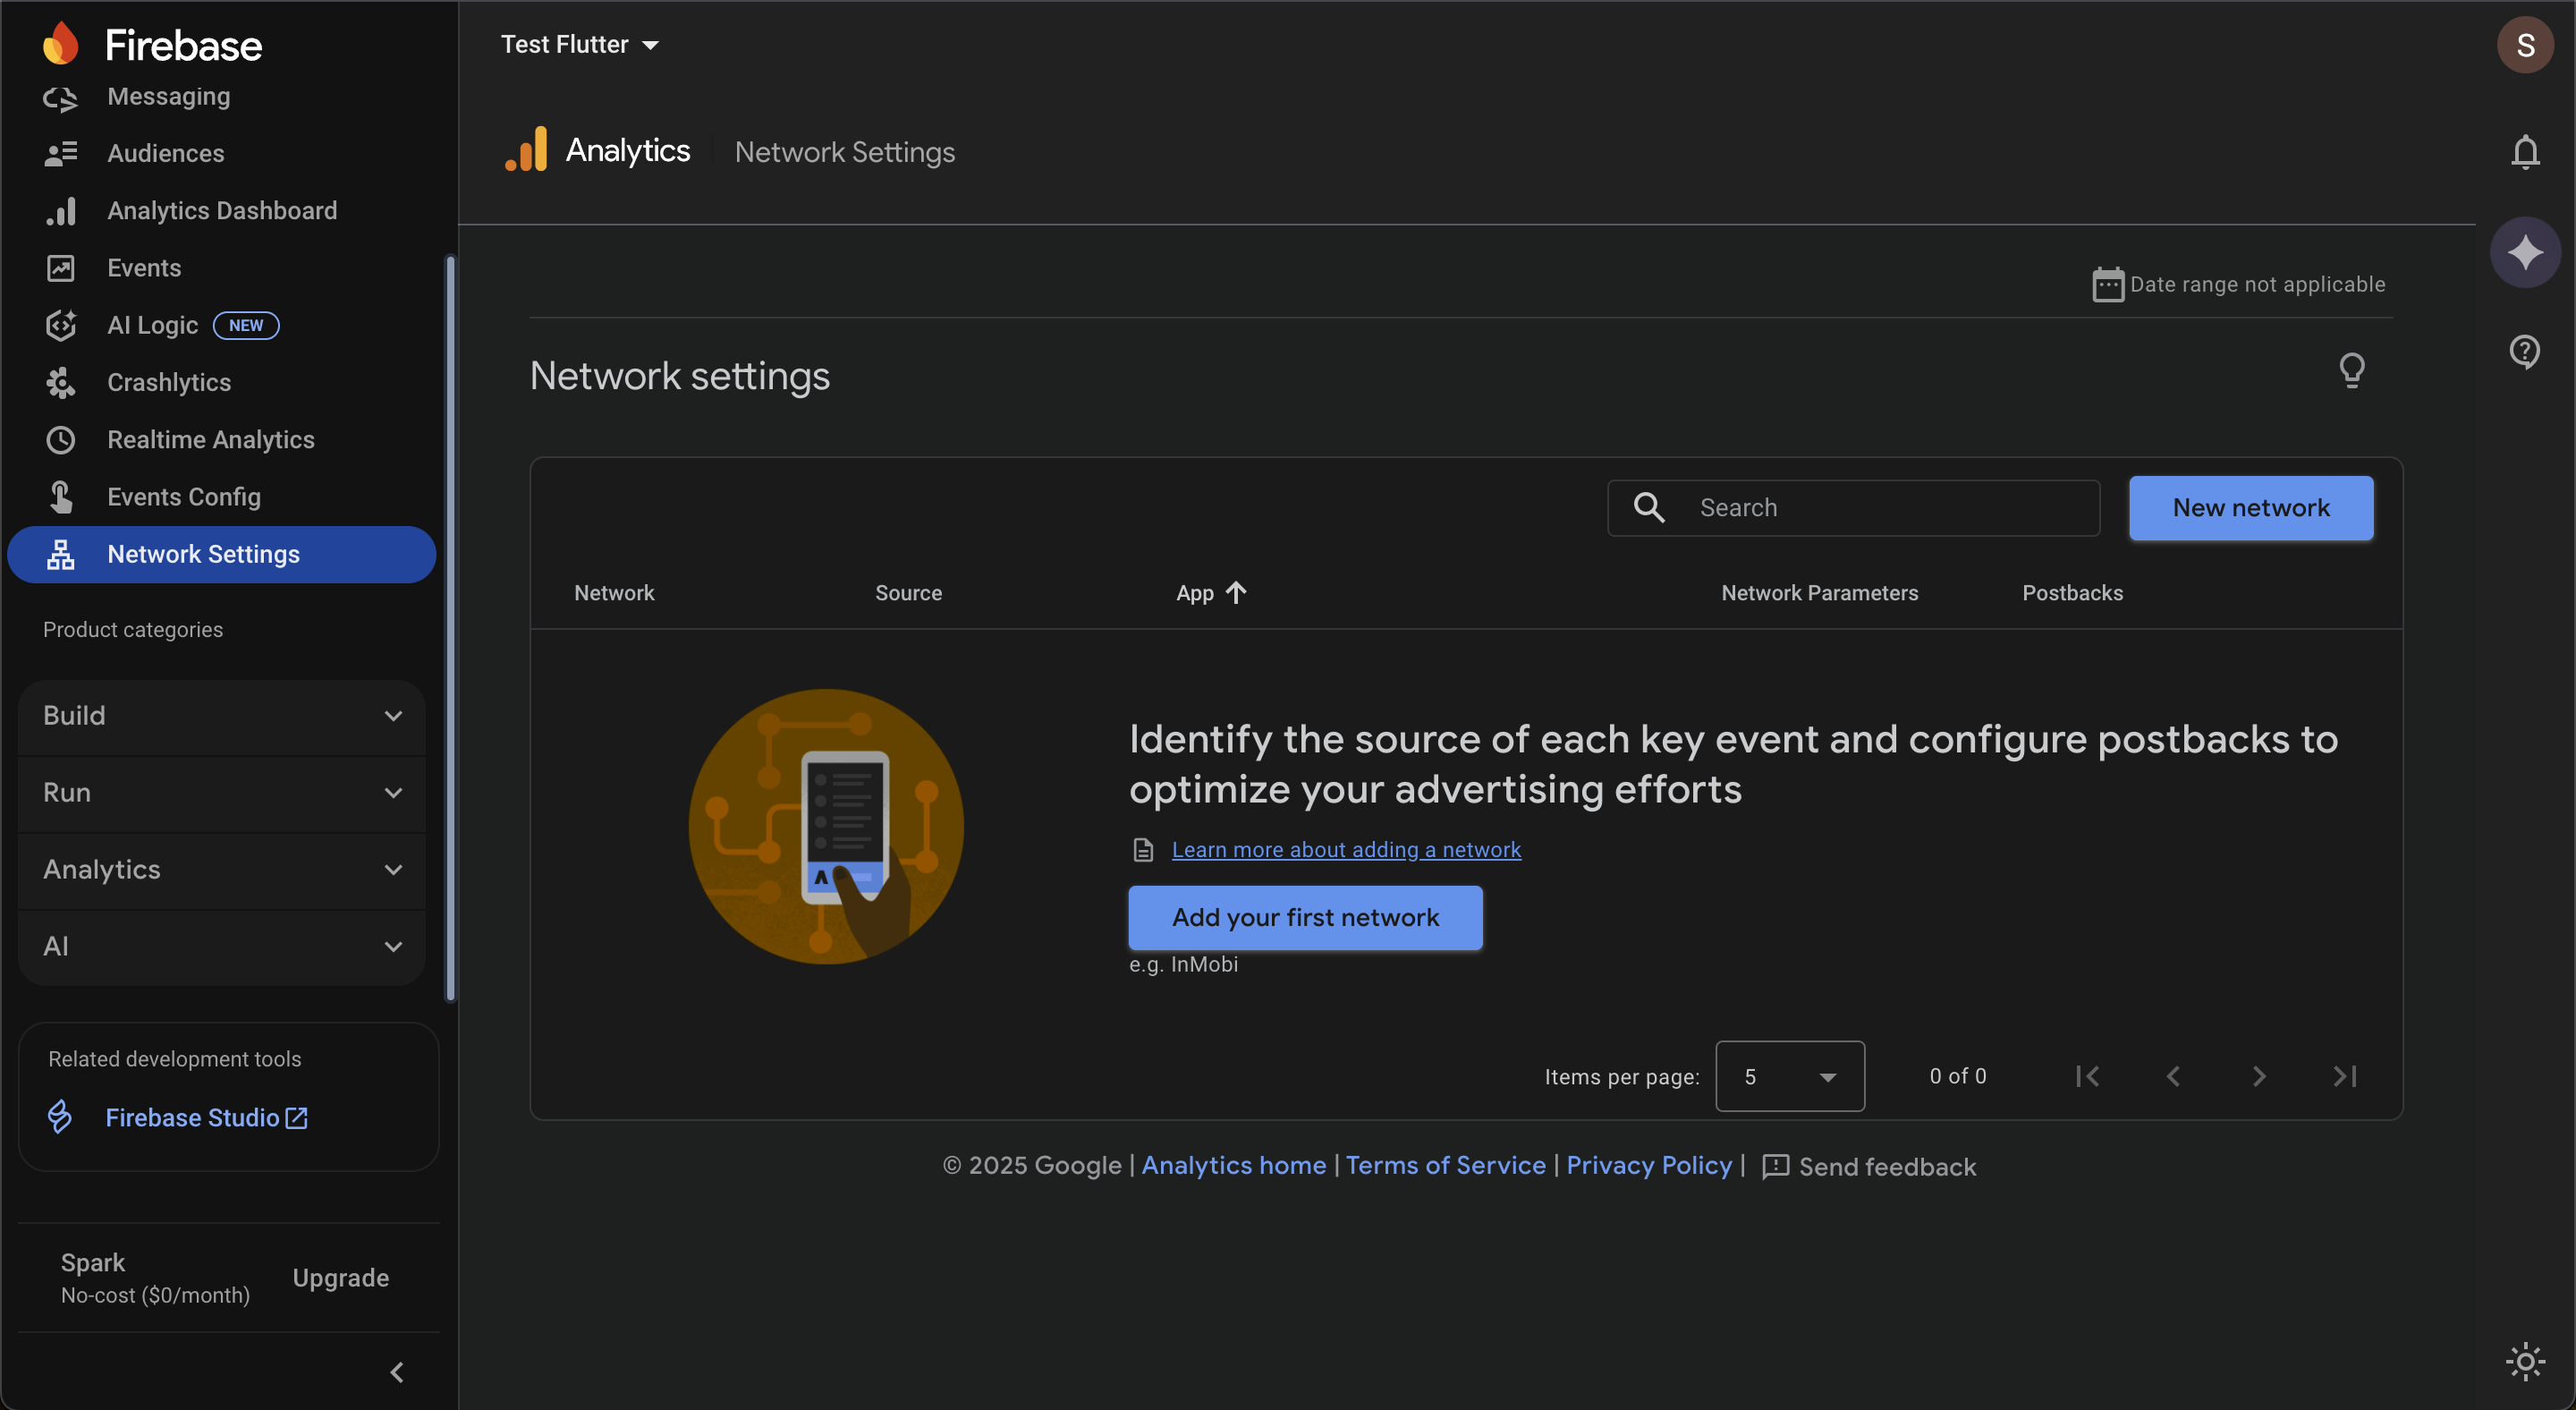
From the Network Settings page, click the 'New network' button. This will open a new pane to configure your network.
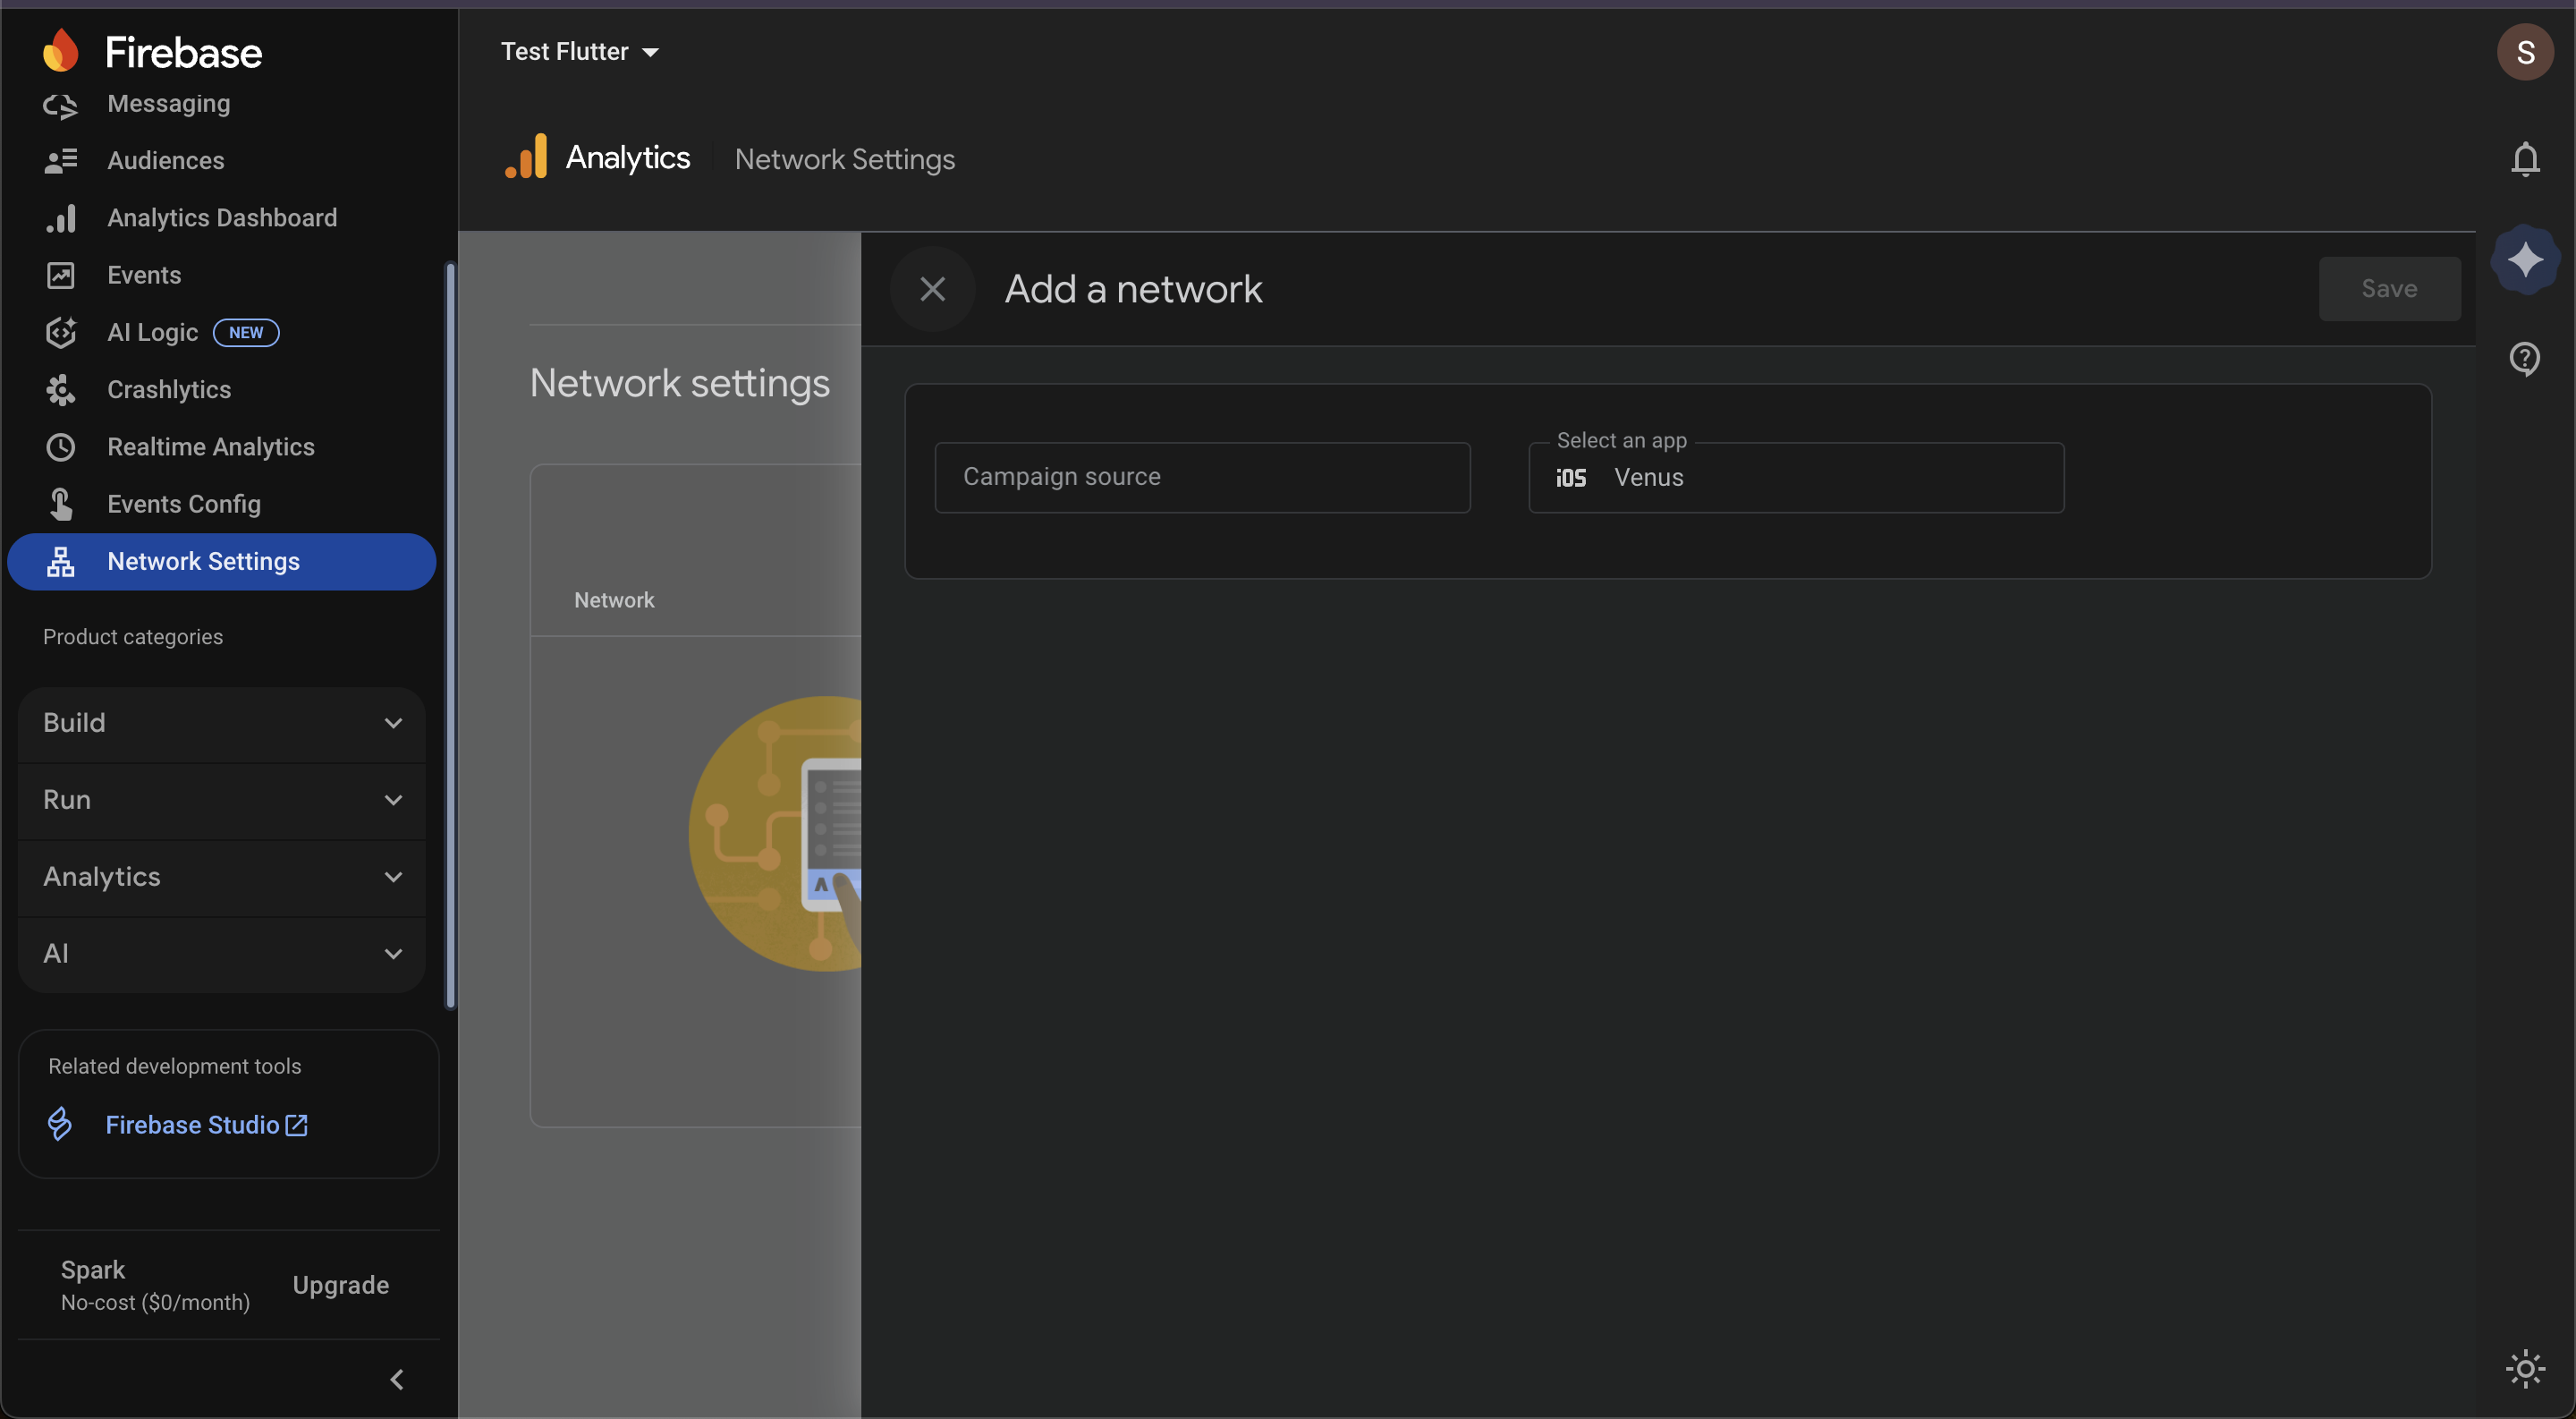
In the 'Add a network' pane, you'll need to configure two main options:
Campaign source: This is where you specify the advertising network you want to integrate with (e.g., Google Ads, Facebook Ads, etc.).
Select an app: Choose the specific app from your Firebase project that you want to associate with this network.
Once you have selected both the campaign source and the app, click 'Save' to add the network.
After adding a network, you can configure postbacks. A postback is a notification sent from Firebase to the ad network when a user completes a specific action (like an app install or a purchase). This helps the ad network accurately track and optimize campaigns.
In the Network Settings table, find the network you just added.
Click on the network to open its detailed settings.
Here you will find options to configure postbacks for different events (e.g., first open, custom events).
You can typically choose which events to send as postbacks and customize parameters as required by the ad network.
Audience is covered in Targeting Push- Why Audience Matters article of Firebase.
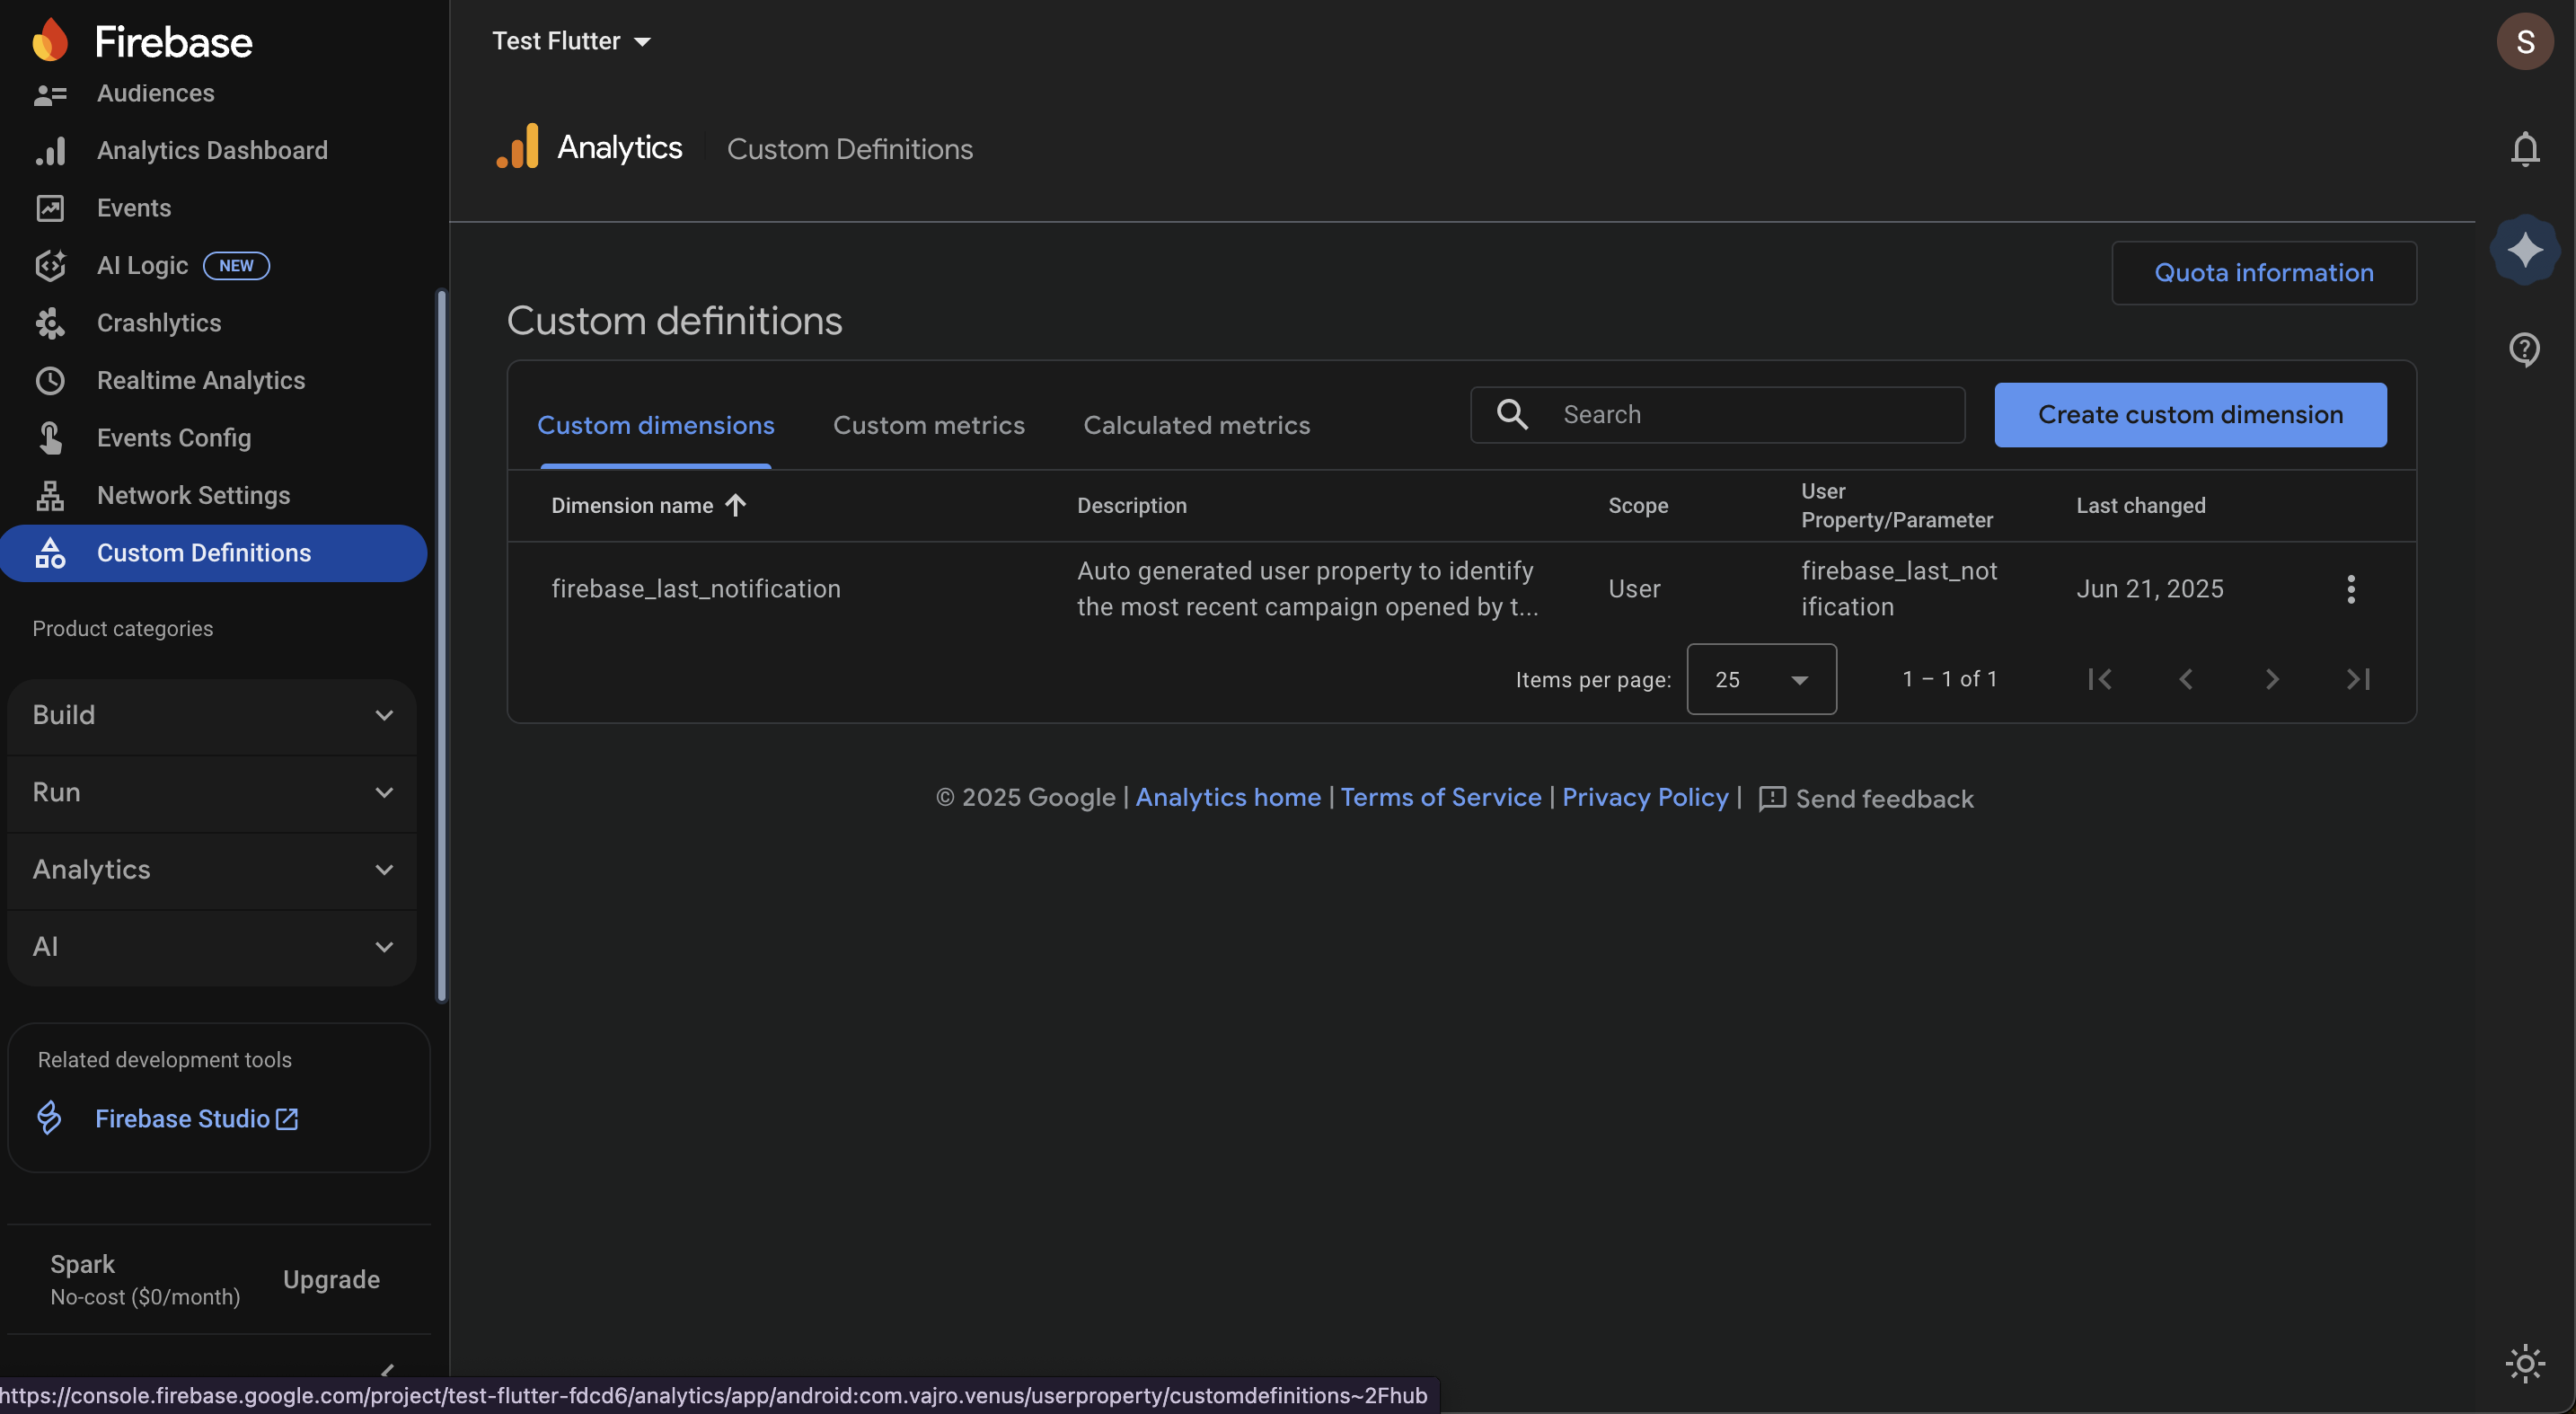
Firebase's Custom Definitions allow you to create custom dimensions and metrics from event parameters and user properties. This provides a more granular view of your data in Firebase Analytics reports, helping you to better understand user behavior.
Go to Firebase console -> Analytics -> Custom Definitions.
Custom dimensions enable you to analyze data based on non-standard event parameters or user properties. They are crucial for reporting on specific data points relevant to your app.
On the Custom Definitions page, ensure you are on the Custom dimensions tab.
Click the 'Create custom dimension' button.
A new pane will appear for creating the dimension. Fill in the following fields:
Dimension name: A descriptive name for your dimension (e.g., item_category).
Scope: Choose the scope for the dimension. This determines whether the data applies to a user, an event, or an item. The options are 'User' or 'Event'.
Description: A brief explanation of what the dimension represents.
Event parameter: Select the specific event parameter from your app's events that you want to define as this dimension.
Before saving, be aware of the warning about creating dimensions with a high number of unique values, as this may negatively impact your reports. It is a best practice to keep the number of unique values manageable.
Click 'Save' to finalize the new custom dimension.
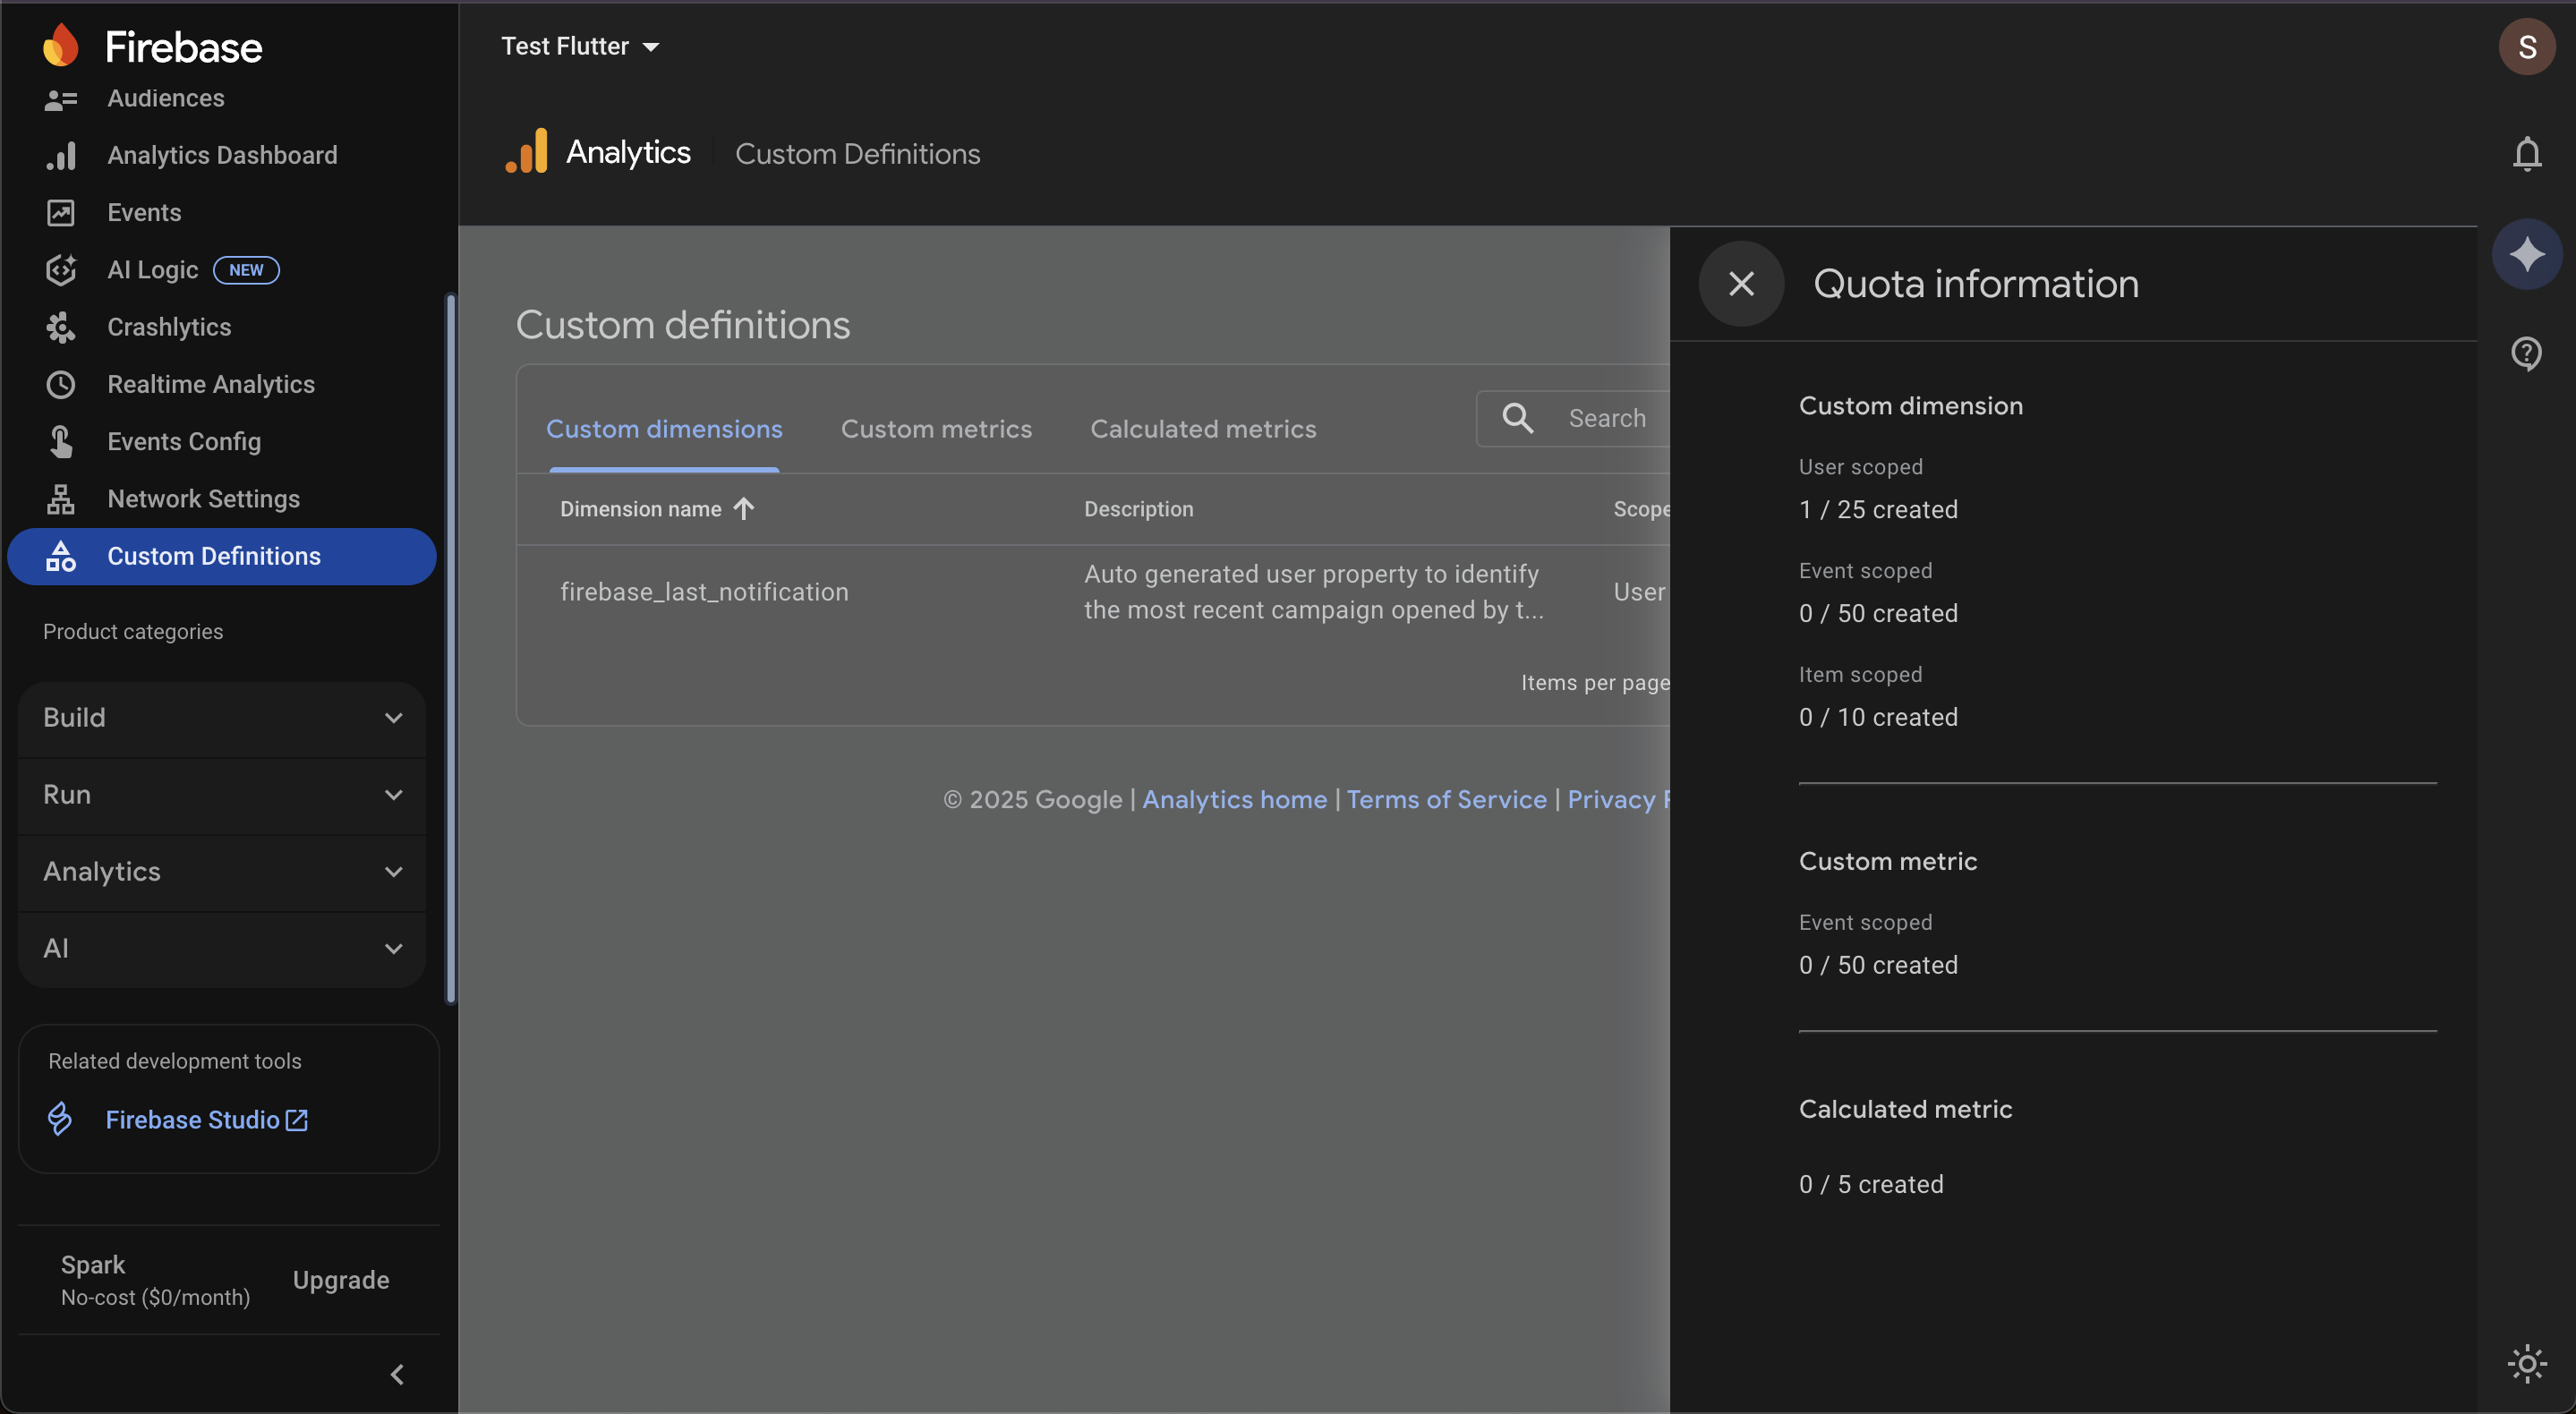
Firebase places a limit on the number of custom definitions you can create. It is important to monitor your quota to ensure you can create all the necessary definitions for your reporting needs.
To check your quota:
On the Custom Definitions page, click the 'Quota information' button located in the top-right corner.
A pane will slide out, displaying your current usage against the maximum limits for:
Custom dimensions: This is broken down by scope (User, Event, Item).
Custom metrics: This is broken down by scope (Event).
Calculated metrics.
The quota information helps you manage your custom definitions efficiently and plan for future reporting needs.
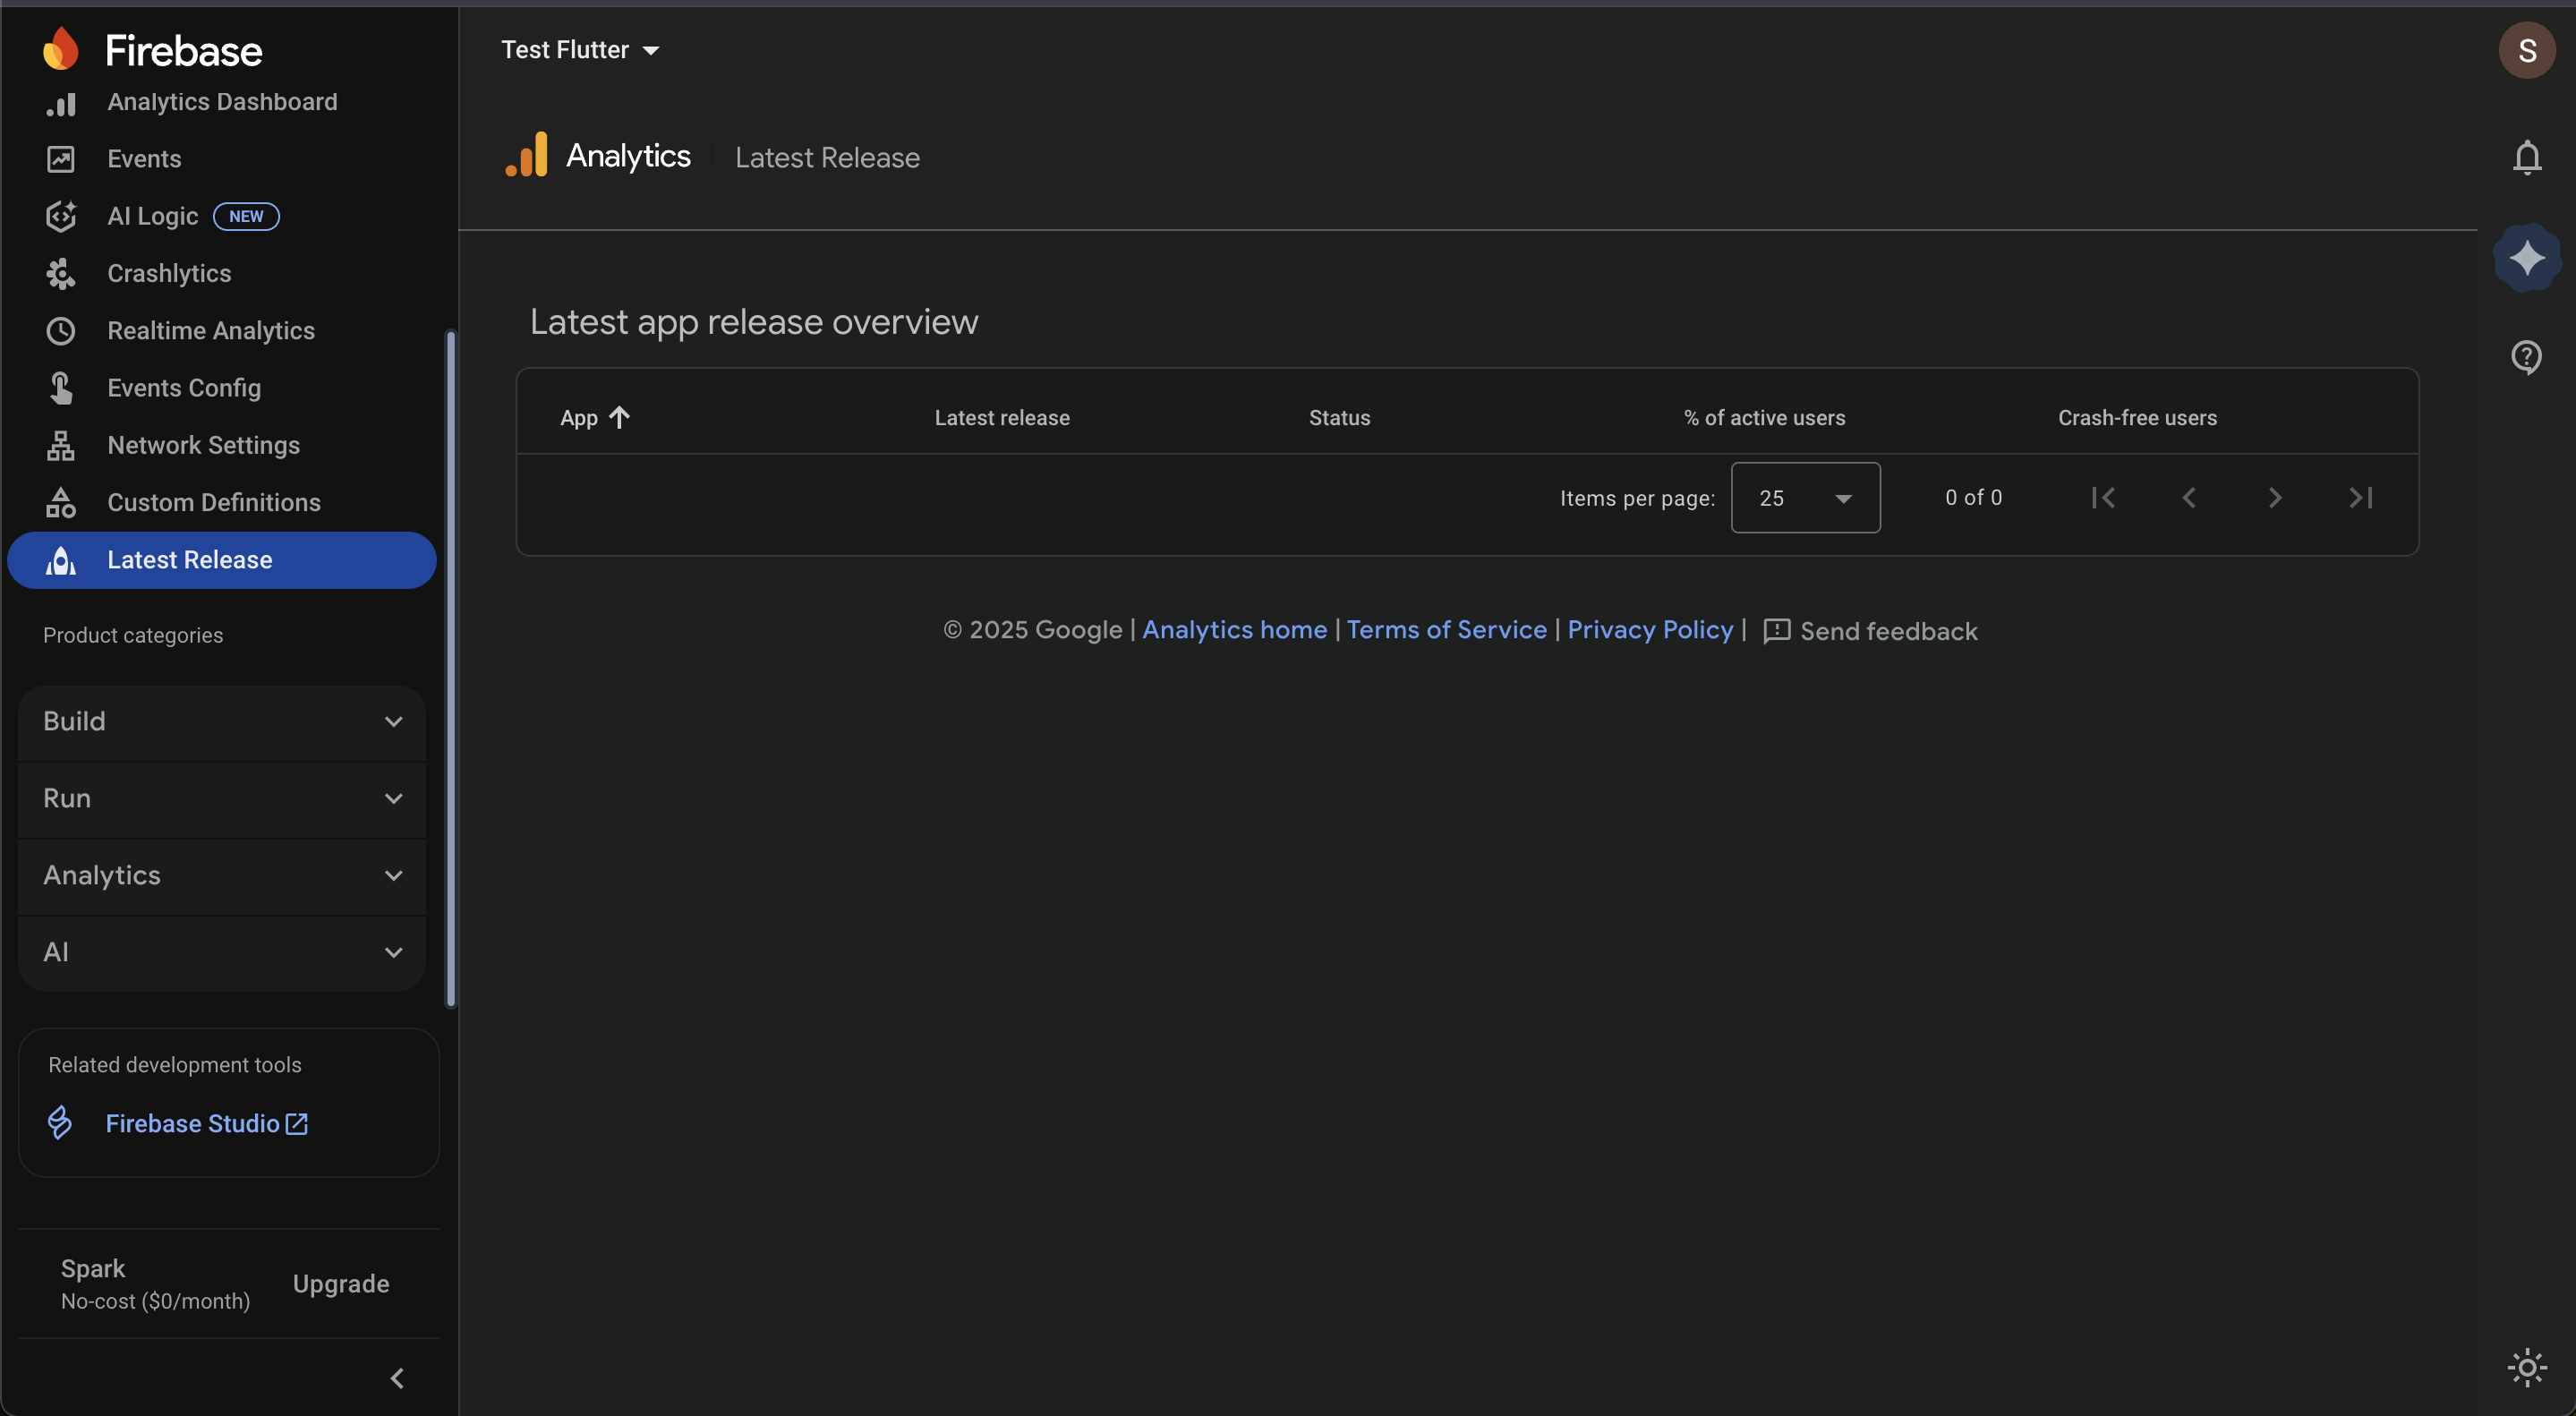
The Latest Release section in Firebase Analytics gives you a quick summary of your app's most recent updates. It helps you monitor how well a new version is doing after you've released it, specifically tracking its adoption and stability.
Go to Firebase console -> Analytics -> Latest Release.
The main table presents key metrics for each app:
Latest release: The version number of the most recent release.
Status: The current state of the rollout (e.g., fully released, staged rollout).
% of active users: The percentage of your active user base that has adopted the latest version of the app.
Crash-free users: The percentage of users on the latest release who haven't experienced a crash.
This feature is a powerful way to quickly check the health of your app updates as they roll out, ensuring a smooth experience for your users.
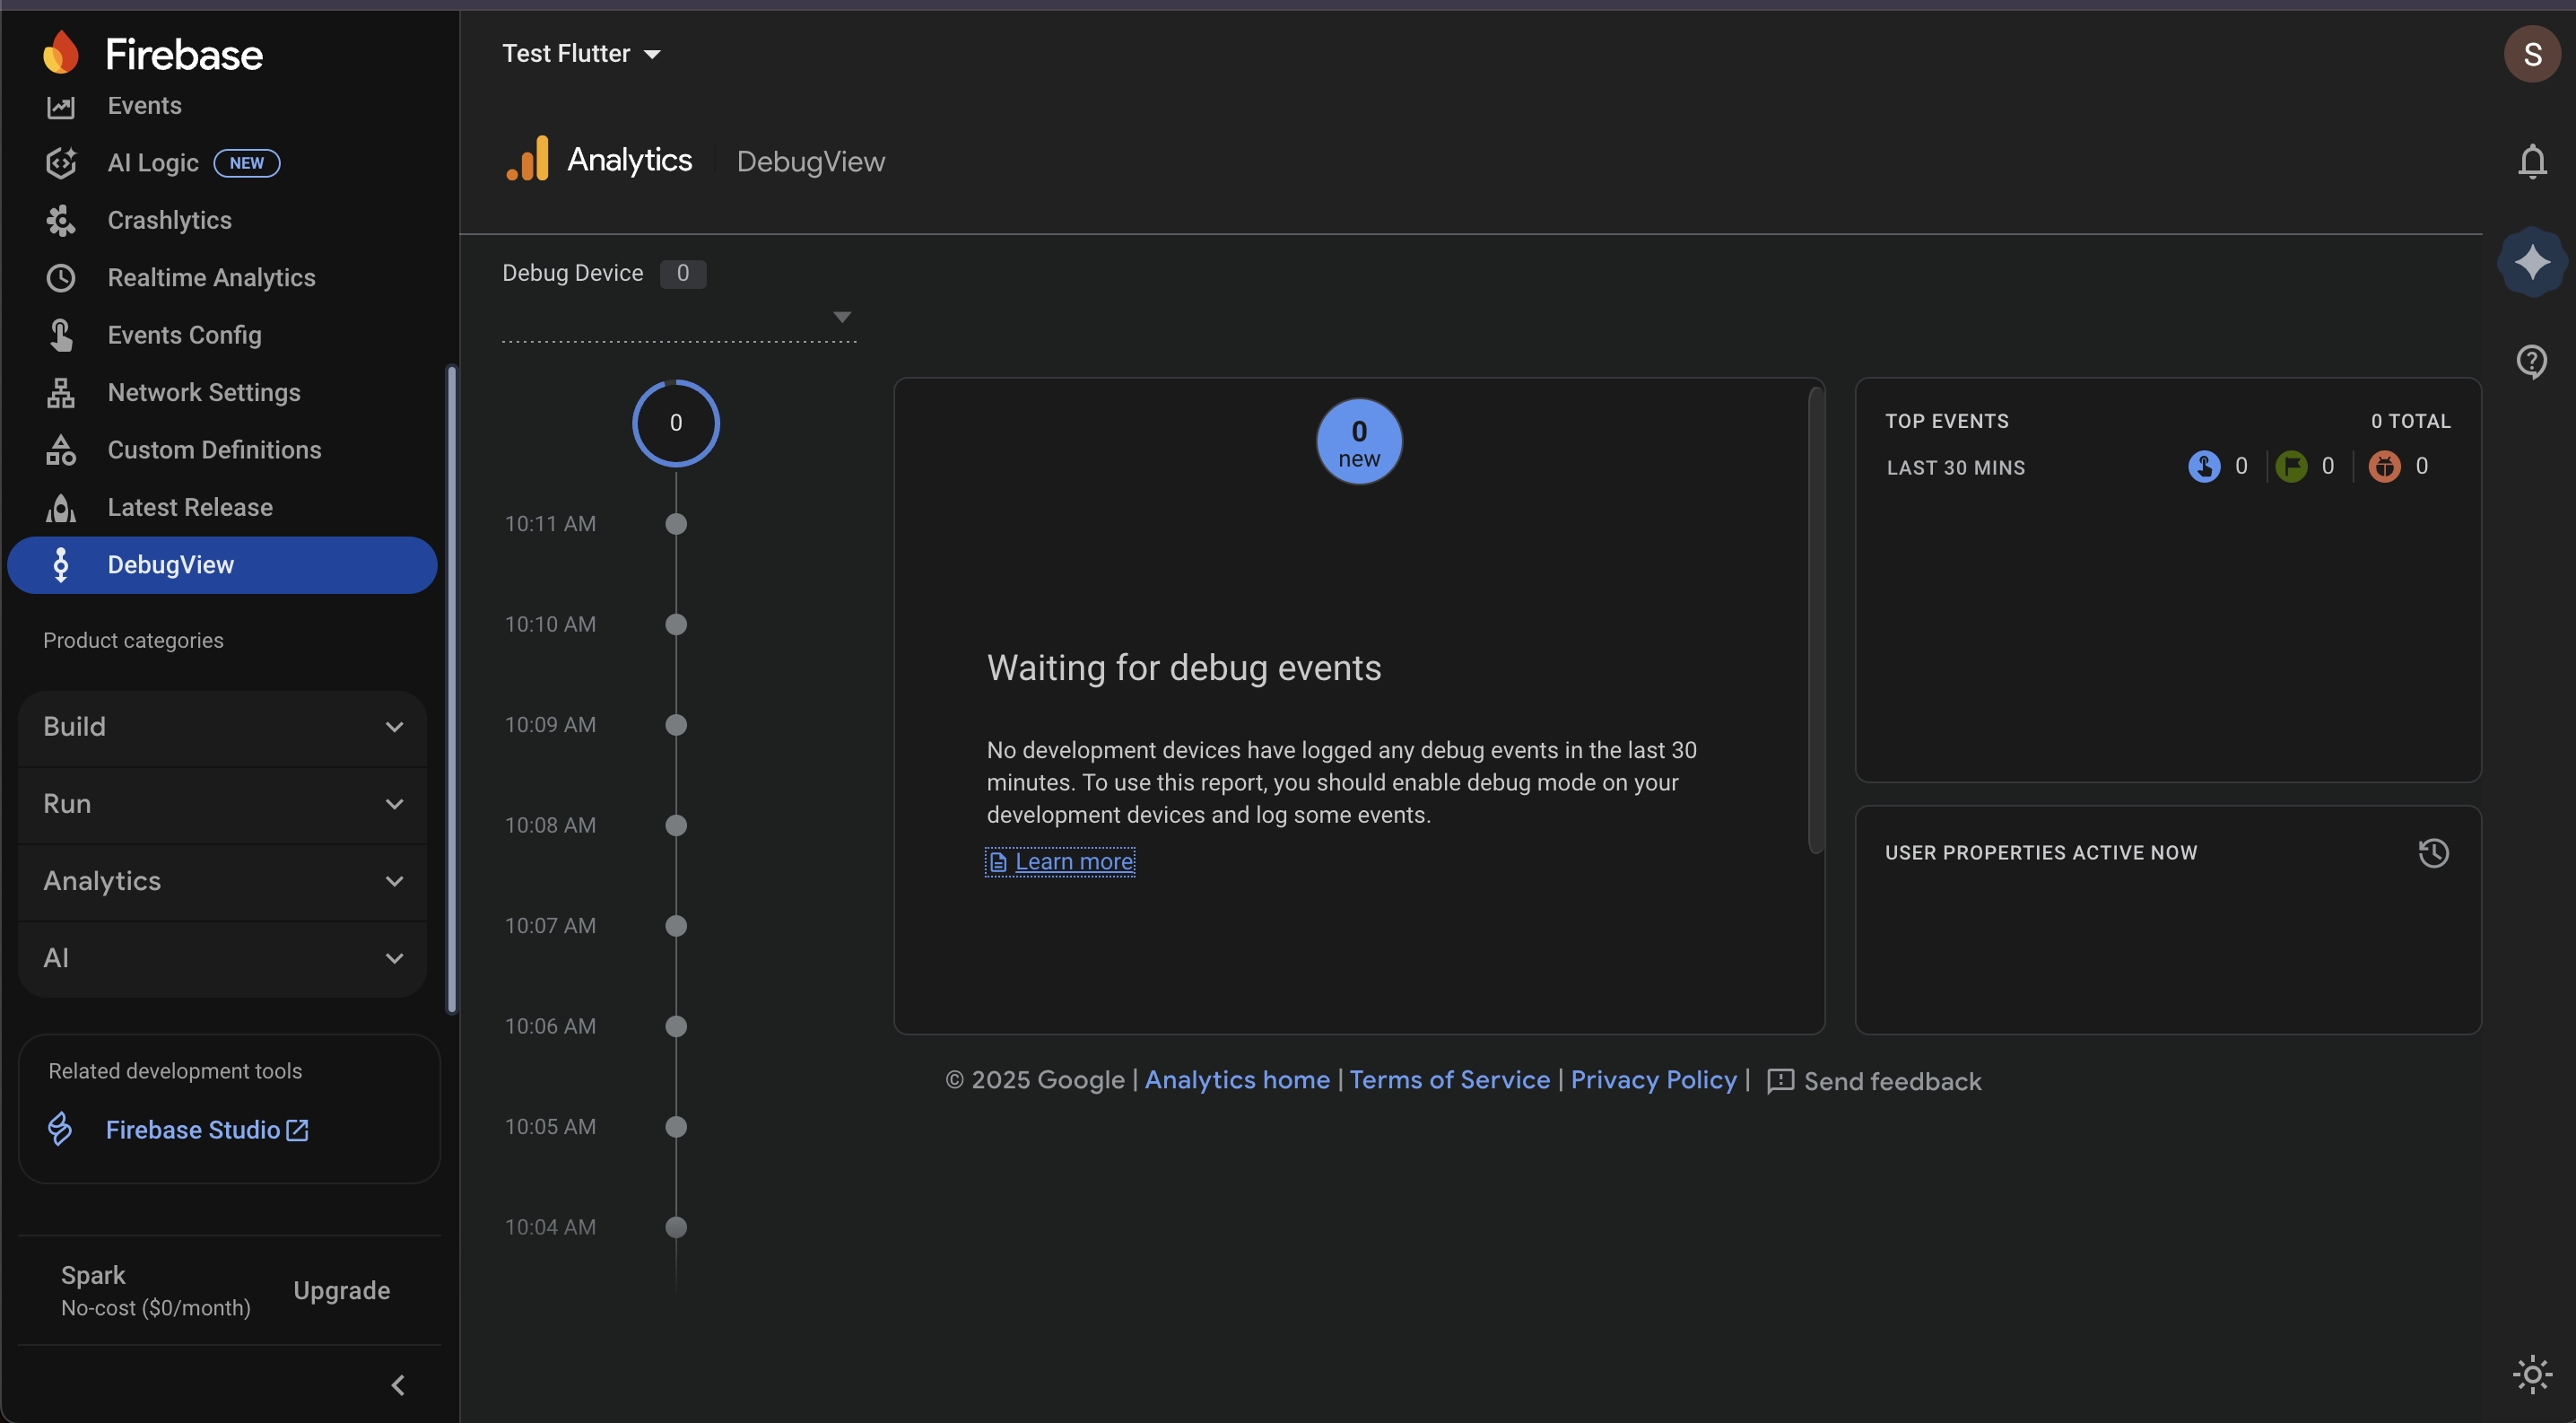
The DebugView section in Firebase Analytics is a powerful tool that allows you to monitor and validate the events and user properties being sent from your development devices in real time. This is essential for debugging your analytics implementation before your app goes live.
Go to Firebase console -> Analytics -> Debug View.
To see data in DebugView, you must first enable debug mode on your development device. The specific method for enabling debug mode varies by platform:
For iOS/macOS: Add the command-line argument -FIRDebugEnabled to your scheme in Xcode.
For Android: Run the following command in your terminal: adb shell setprop debug.firebase.analytics.app <your_app_package_name>
Once debug mode is enabled and you've started logging events from your device, data will begin to populate the DebugView report.
Timeline: The central column shows a real-time stream of events, displaying when each event was logged.
Event Details: Clicking on an event in the timeline will show all its associated parameters and values.
Top Events: This panel lists the most frequently logged events from your debug device in the last 30 minutes.
User Properties Active Now: This panel displays the user properties that are currently set on your device.
Plugin Enablement
Ensure automated push notifications are supported by linking analytics and push under the same Firebase account.
Control plugin behavior through app rollouts for smoother deployment.
1. Firebase Analytics Dashboard
User Activity & Real-Time Views: Spot seasonal spikes (e.g., holidays or sales) and adjust promotions.
App Stability & Engagement: Detect crash issues early to reduce churn and boost user satisfaction.
Acquisition Insights: Evaluate which campaigns bring in high-value customers and reallocate budget.
Audience & Segmentation: Compare performance of iOS vs Android users or new vs returning users.
Content & Events: Identify top-performing screens and optimize navigation or product placement.
Revenue Metrics: Measure revenue impact per user and improve monetization strategies.
Reporting Tools: Share annotated reports with stakeholders to align marketing and product teams.
2. Firebase Realtime Analytics
Realtime Tracking: Validate if a new ad campaign is driving immediate engagement.
Engagement: Watch purchase events live during a flash sale or holiday promotion.
User Snapshot: Debug issues like failed checkouts by monitoring a single user’s journey in real time.
3. Events
Track Event Metrics: Identify which user actions (e.g., add-to-cart vs checkout) drive revenue.
Optimize Features: Double down on features that show high engagement and cut underperforming ones.
Campaign Success: Measure whether marketing pushes translate to actual purchases.
The Superfans app supports a wide range of custom events to help track user activity and shopping behavior. These include:
User Login – when a user signs into the app.
User Logout – when a user signs out of the app.
Page Opened – whenever a new page is opened.
Bottom Bar Switched – when the user switches tabs from the bottom navigation bar.
Top Navigation Switched – when navigation occurs using the top menu.
Side Navigation Opened – when the side menu is expanded.
Side Navigation Closed – when the side menu is closed.
Product Viewed – when a user views a specific product.
Collection Viewed – when a collection or category page is viewed.
Variant Changed – when a user switches product variants (e.g., size, color).
Added to Wishlist – when an item is added to the wishlist.
Removed from Wishlist – when an item is removed from the wishlist.
Cart Updated – whenever the cart is updated with changes.
Added to Cart – when an item is added to the cart.
Cart Quantity Updated – when the quantity of a cart item is changed.
Removed from Cart – when an item is removed from the cart.
On Checkout Click – when a user clicks the checkout button.
Search Performed – when a search is initiated.
Collection Sorted – when a collection is sorted (e.g., by price, popularity).
Collection Filtered – when filters are applied to a collection.
Search Results Sorted – when search results are sorted.
Search Results Filtered – when filters are applied to search results.
Purchase Event – when a completed purchase takes place.
4. Event Configuration
Key Events: Prioritize critical actions (like purchases or sign-ups) to measure business growth.
Quota Management: Manage event tracking efficiently to stay within free-tier limits.
Attribution Settings: Accurately credit ad networks to optimize ad spend.
Custom Configurations: Track unique in-app actions (e.g., wishlist adds, referrals) for deeper insights.
5. Network Settings
Add Networks: Connect multiple ad platforms to track performance across channels.
Configure Postbacks: Share conversion data with ad networks to improve campaign optimization.
Business Value: Ensure accurate attribution of installs and purchases, maximizing ROI from ad spend.
6. Audience
Targeting: Build tailored campaigns for specific segments (e.g., high spenders, new users).
Retention: Identify groups at risk of churn and engage them with push notifications or offers.
7. Custom Definitions
Custom Dimensions: Track app-specific data (e.g., membership tier, subscription type).
Business Value: Unlock deeper insights beyond standard Firebase parameters for better decisions.
8. Latest Release
Monitor Adoption: Quickly see how many users upgraded to the new version.
Check Stability: Ensure new features don’t increase crashes.
Business Value: Validate product rollouts and respond to issues before they affect revenue.
9. Debug View
Test Setup: Validate events before launch to avoid broken data in production.
Business Value: Save time and cost by catching tracking issues early.