Klaviyo dashboards give you a centralized, customizable view of your marketing performance across email, SMS, flows, push notifications, and deliverability. They allow you to track revenue, conversions, engagement, and overall business health over any chosen time period. Two primary dashboards are available:
Overview Dashboard: Pre-built, high-level insights across campaigns, flows, and channels.
Business Review Dashboard: Revenue-focused, detailed view of performance trends, deliverability, and channel health.
These dashboards are view-only; you can adjust metrics, date ranges, and comparison periods but cannot edit, remove, or reorder default cards.
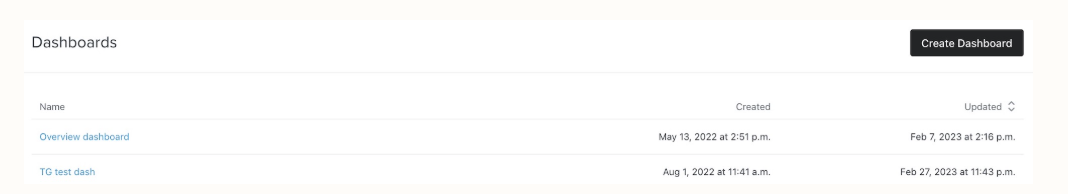
Navigate to Analytics > Dashboards.
Select a pre-existing dashboard or click Create Report / Create Dashboard to start a new one.
For new dashboards, you can add pre-built cards from the Data View Library or create custom cards from scratch.
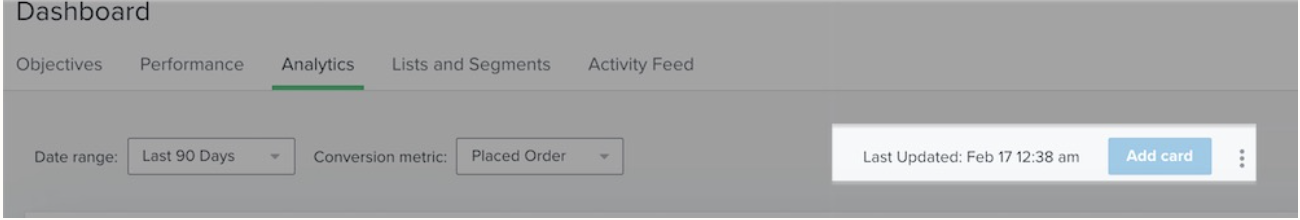
1. Date Range
Default: Last 30 days
Options: Week-to-date, Month-to-date, Last 7/30/90 days, Month-to-date, Year-to-date, Last year, or Custom (max 12 months for Overview, 48 months for Business Review)
All dates are inclusive of start and end dates and respect your account’s local timezone.

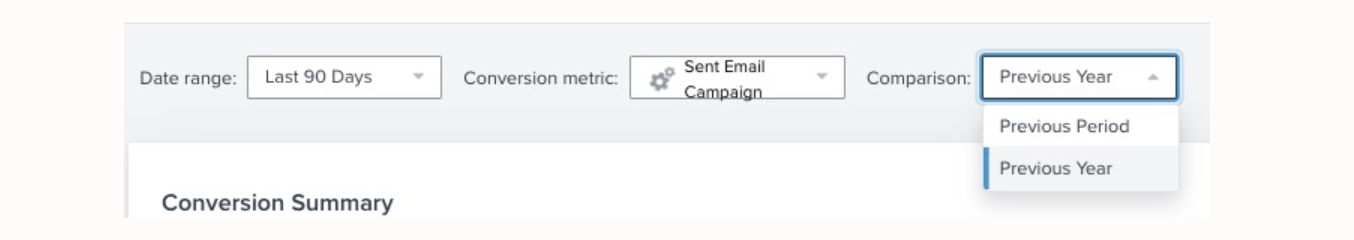
2. Comparison Period
Compare to Previous Period, Previous Year, or a Custom Range.
Previous year comparisons use exact date matches (e.g., Sept 1–30, 2023 compared to Sept 1–30, 2022).
3. Conversion Metric
Revenue-based metrics: Placed Order, Started Checkout, Fulfilled Order (monetary values displayed)
Non-revenue metrics: Active on Site, Opened Email, Clicked Email (conversion counts)
Metrics apply across all cards on the dashboard.

4. Refresh Dashboard
Timestamp in the top-right shows last update.
Manually refresh via three-dot menu (...) > Refresh Data.
1. Conversion / Growth Overview Cards
Shows attributed vs. unattributed revenue, conversions, and engagement.
Breakdown by channel (email, SMS, push) and message type over time.
2. Campaign Performance Cards
Metrics: Revenue, recipients, open rates, click rates, average order value.
Tabs: Overview, Metrics, Top Performing Campaigns.
Compare campaigns to peer benchmarks for context.
3. Campaign Performance Detail Card
Table of all campaigns in the selected date range.
Metrics: Delivered, Unique Opens, Clicks, Unique Orders, Revenue per recipient.
4. Flows Performance Cards
Overview and detail of all flows (live, manual, draft) by channel.
Metrics: Recipients, Delivered, Open rate, Click rate, Placed Order rate, Revenue per recipient.
Filter by channel; exclude draft flows if needed.
5. Deliverability Cards
Email: Bounce, Spam, Unsubscribe rates.
SMS: Failed to deliver, Unsubscribe rates.
Push: Delivery rate, Click rate.
Identify issues impacting sender reputation and message reach.
6. Funnel Summary Cards
Email, SMS, and Push funnel cards visualize delivery → opens → clicks → conversions.
Spot drop-off points for optimization.
7. Forms Performance Cards
Tracks form views and submission rates.
Includes detailed performance for individual forms and comparison to peer benchmarks (popups only).
8. Flows Conversion Card
Shows revenue trends and total attributed revenue for all flows.
Compare up to 5 flows individually or view aggregated data.
9. Subscriber Growth Card
Monitors subscriber trends across email and SMS channels.
Access full subscriber growth report for detailed analysis.
10. Additional Cards from Data View Library
Conversion by channel, Email Deliverability by Domain, Flow Volumes, Forms Performance Detail, etc.
Max 10 cards per dashboard; create custom cards if needed.
Click Add Card > Create from Scratch.
Select your metric, display type (Average, Counts, Unique Counts, Value).
Choose grouping and up to 5 filters.
Visualize as table, line, bar, or single value.
Edit or delete using the three-dot menu (...) in the card.
Reorder cards: Drag using top-middle handle.
Export: Three-dot menu (...) > Print to PDF (graphs and tables included).
Rename Dashboard: Three-dot menu (...) > Edit Name.
Delete Dashboard: From list or inside dashboard > three-dot menu > Delete Dashboard (cannot be recovered).
Add Additional Dashboards: Create up to 10 dashboards in total.